Exponential Family of Distributions
Most common distributions, including the Bernoulli, Poisson, exponential, Gaussian, gamma and beta distributions, can be written in a common exponential form, whose logarithm turns a product of probabilities into a simple sum. The set of such distributions is called the Exponential Family of Distributions. This post looks at the common distributions that belong to the family, defines the family and its properties, and derives the maximum likelihood estimator of the whole family.
Detour: relationship between common probability distributions
Only 15 of the many probability distributions are commonly used, and they are related to each other. The following diagram shows the mass function of each discrete distribution as bars and the density function of each continuous distribution as a curve, with arrows between related distributions:
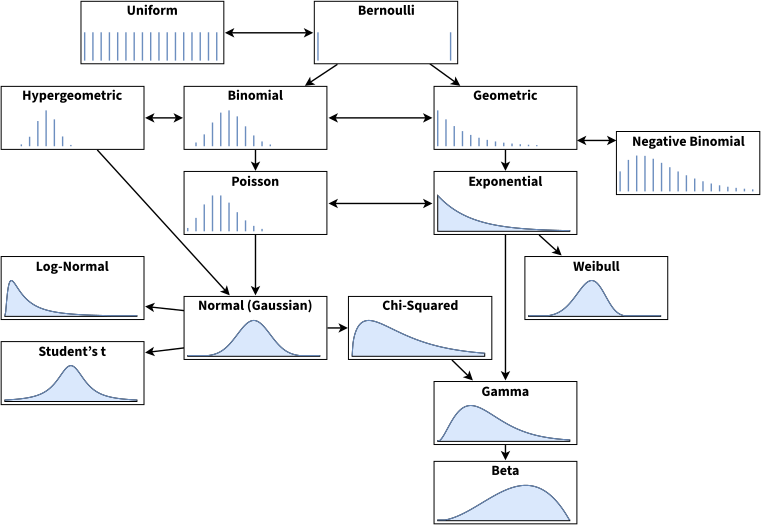
Adapted from: Common probability distributions: the data scientist’s crib sheet, S. Owen
A brief summary of their relationships follows:
- Bernoulli and Uniform: the uniform distribution assigns equal probability to each discrete outcome, e.g. a coin toss or a dice roll; the Bernoulli assigns the probabilities \(p\) and \(1-p\), which may differ, to two discrete outcomes, e.g. an unfair coin toss (with \(p = 1/2\), it is the uniform distribution of a fair coin toss);
- Binomial and Hypergeometric: the binomial can be seen as the distribution of the sum of outcomes of something that follows a Bernoulli distribution, e.g. if a dice is rolled 30 times, how many times does a six come up? This count follows the binomial distribution, with parameters \(n\), the number of trials, and \(p\), the probability of success (a la Bernoulli). The binomial assumes independent trials, i.e. draws with replacement, while the hypergeometric distribution counts the successes in \(n\) draws without replacement from a finite population that contains a fixed number of successes;
- Poisson and Binomial: like the binomial distribution, the Poisson distribution is a distribution of a count: the number of times some event happened over a fixed interval of time, given a rate for the event to occur. It is parametrized as \(\lambda = np\) (the \(n\) and \(p\) parameters of the binomial, in the limit of a large \(n\) and a small \(p\));
- Geometric and Negative Binomial: while the binomial counts the number of times an event succeeds after a number of trials, the geometric distribution counts how many failed trials occur until the event succeeds. The negative binomial distribution is a simple generalization of the geometric, measuring the number of failures until \(r\) successes have occurred, not only 1;
- Exponential and Weibull: the exponential distribution is the geometric on a continuous interval, parametrized by \(\lambda\), like the Poisson. While it describes “time until event or failure” at a constant rate, the Weibull distribution models increases or decreases of the rate of failures over time (i.e. models time-to-failure);
- Normal, Log-Normal, Student’s t, and Chi-squared: if one takes a large set of independent values following the same (any) distribution with a finite variance and sums them, that sum approximately follows the normal distribution. This is true regardless of the underlying distribution, and this phenomenon is called the Central Limit Theorem. The log-normal distribution relates to variables whose logarithm is normally distributed. The exponentiation of a normally distributed variable is log-normally distributed. Student’s t-distributions are normal-like distributions with a fatter tail, although they approach the normal distribution as the parameter (the number of degrees of freedom) increases. The chi-squared distribution is the distribution of the sum of squares of independent, standard normally distributed values;
- Gamma and Beta: the gamma distribution is a generalization of the exponential and the chi-squared distributions. Like the exponential distribution, it is used to model waiting times, e.g. the time until the next \(n\) events occur. It appears in machine learning as the conjugate prior to some distributions. The beta distribution is the conjugate prior to the Bernoulli, binomial, negative binomial and geometric distributions.
Twelve of these 15 distributions belong to the exponential family defined in the next section. Nine of them belong to it with all their parameters unknown: the Bernoulli, Poisson, geometric, exponential, normal, log-normal, chi-squared, gamma and beta distributions. Three more belong to it only when one of their parameters is known: the binomial (with \(n\) known), the negative binomial (with \(r\) known) and the Weibull distribution (with its shape known). The other three, the hypergeometric, Student’s t and the uniform distributions, do not belong to it.
Exponential Family of distributions
The exponential family of distributions is the set of distributions parametrized by \(\theta \in \mathbb{R}^D\) that can be described in the form:
\[p(x \mid \theta) = h(x) \exp \left(\eta(\theta)^T T(x) -A(\theta)\right) \label{eq_main_theta}\]or in a more extensive notation:
\[p(x \mid \theta) = h(x) \exp\left(\sum_{i=1}^s \eta_i(\theta) T_i(x) - A(\theta) \right)\]where \(T(x)\), \(h(x)\), \(\eta(\theta)\), and \(A(\theta)\) are known functions, and \(s\) is the number of components of \(T(x)\). An alternative notation to equation \ref{eq_main_theta} describes \(A\) as a function of \(\eta\), regardless of the transformation from \(\theta\) to \(\eta\). This new expression is called an exponential family in its natural form (or canonical form), and it looks like:
\[p(x \mid \eta) = h(x) \exp \left(\eta^T T(x) -A(\eta)\right) \label{eq_main_eta}\]The term \(h(x)\) is the base measure, a non-negative function that depends only on \(x\).
The term \(T(x)\) is a sufficient statistic of the distribution. The sufficient statistic is a function of the data that holds all the information the data \(x\) provides with regard to the unknown parameter values:
- The intuitive notion of sufficiency is that \(T(X)\) is sufficient for \(\theta\) if there is no information in \(X\) regarding \(\theta\) beyond that in \(T(X)\). That is, once \(T(X)\) is observed, \(X\) can be thrown away for the purposes of inference with respect to \(\theta\);
- Moreover, this means that the likelihood ratio is the same for any two datasets \(x\) and \(y\) with the same sufficient statistic, i.e. if \(T(x)=T(y)\), then \(\frac{p(x \mid \theta_1)}{p(x \mid \theta_2)} = \frac{p(y \mid \theta_1)}{p(y \mid \theta_2)}\);
- The Pitman–Koopman–Darmois theorem states that, among the families of distributions whose support (the set of values with a nonzero probability) does not depend on the parameters, only exponential families have a sufficient statistic whose dimension remains bounded as the number of samples increases.
The term \(\eta\) is the natural parameter, and the set of values of \(\eta\) for which \(A(\eta)\) is finite is called the natural parameter space, which is always convex.
The term \(A(\eta)\) is the log-partition function, because it is the logarithm of a normalization factor that ensures that the distribution \(p(x \mid \theta)\) sums up or integrates to one (without which \(p(x \mid \theta)\) would not be a probability distribution), i.e.:
\[A(\eta) = \log \int_x h(x) \exp (\eta^T T(x)) \, \mathrm{d}x;\]Another important point is that the mean and variance of \(T(x)\) can be derived by differentiating \(A(\eta)\) and computing its first and second derivatives, respectively:
\[\begin{align*} \frac{dA}{d\eta^T} & = \frac{d}{d\eta^T} \left( \log \int_x h(x) \exp (\eta^T T(x)) \, \mathrm{d}x \right) \\ & = \frac{ \int_x T(x) h(x) \exp (\eta^T T(x)) \, \mathrm{d}x}{\int_x h(x) \exp (\eta^T T(x)) \, \mathrm{d}x} \\ & \qquad \text{(log derivative rule: } \frac{d}{dx} \log f(x) = \frac{f'(x)}{f(x)} \text{)} \\ & = \int_x T(x) h(x) \exp(\eta^TT(x) - A(\eta)) \, \mathrm{d}x \\ & \qquad \text{(definition of } p(x \mid \eta) \text{, and } \frac{e^a}{e^b} = e^{a-b} \text{)} \\ & = \mathbb{E}[T(X)] \\ & \qquad \text{(def. expected value: } \mathbb{E}[X] = \int_x x \, f(x) dx \text{, for density func. } f(x) \text{)} \\ \end{align*}\]i.e. the first derivative of \(A(\eta)\) is equal to the mean of the sufficient statistic. Now consider the second derivative:
\[\begin{align*} \frac{d^2A}{d\eta\,d\eta^T} & = \int_x h(x) T(x) \left( T(x) -\frac{d}{d\eta^T}A(\eta)\right)^T \, \exp\left(\eta^TT(x) - A(\eta)\right) \, dx \\ & = \int_x h(x) T(x) \left( T(x) - \mathbb{E}[T(X)] \right)^T \, \exp\left(\eta^TT(x) - A(\eta)\right) \, dx & (\frac{dA}{d\eta^T} = \mathbb{E}[T(X)])\\ & = \mathbb{E}[T(X)T(X)^T] -\mathbb{E}[T(X)] \, \mathbb{E}[T(X)]^T & (\mathbb{E}[X] = \int_x x \, f(x) dx)\\ & = \operatorname{Var}[T(X)] & (\operatorname{Var}(X)=\mathbb{E}[X^2]-\mathbb{E}[X]^2)\\ \end{align*}\]and, as expected, the second derivative is equal to the variance of \(T(X)\). The mean and the variance are the first two cumulants of \(T(X)\), and the higher derivatives of \(A(\eta)\) give its higher cumulants: the cumulant generating function of \(T(X)\) is \(A(\eta + u) - A(\eta)\), which is why \(A(\eta)\) is also called the cumulant function.
One requirement of exponential family distributions is that the density must factorize (i.e. must be separable into products, each involving only one type of variable, \(x\) or \(\theta\)), as either the power or the base of an exponentiation operation. I.e. the factors must be one of the following:
\[f(x), g(\theta), c^{f(x)}, c^{g(\theta)}, {[f(x)]}^c, {[g(\theta)]}^c, {[f(x)]}^{g(\theta)}, {[g(\theta)]}^{f(x)}, {[f(x)]}^{q(x)g(\theta)}, \text{ or } {[g(\theta)]}^{q(x)j(\theta)}\]where \(f\) and \(q\) are arbitrary functions of \(x\), \(g\) and \(j\) are arbitrary functions of \(\theta\); and \(c\) is an arbitrary constant expression.
In practice, the logarithm of the density, \(\log h(x) + \eta(\theta)^T T(x) - A(\theta)\), is a sum of terms that each depend on \(x\) only, on \(\theta\) only, or on the product of a function of \(x\) and a function of \(\theta\). Student’s t-distribution is not in the family, as its density, proportional to \(\left( 1 + (x - \mu)^2 / \nu \right)^{-(\nu + 1)/2}\) for \(\nu\) degrees of freedom, mixes \(x\) and the parameters inside a sum that the logarithm cannot split. Also, since the exponential is never zero, the support of \(p(x \mid \theta)\) is the support of \(h(x)\), which does not depend on \(\theta\): the uniform distribution on \([0, \theta]\), whose support grows with \(\theta\), is not in the family either.
Another important point is that the product of two exponential-family distributions is also part of the exponential family, but unnormalized:
\[\left[ h(x) \exp \left(\eta_1^T T(x) -A(\eta_1)\right) \right] \times \left[ h(x) \exp \left(\eta_2^T T(x) -A(\eta_2)\right) \right] = \widetilde{h}(x) \exp \left(\left(\eta_1+\eta_2\right)^T T(x) -\widetilde{A}(\eta_1, \eta_2)\right)\]where \(\widetilde{h}(x) = h(x)^2\) and \(\widetilde{A}(\eta_1, \eta_2) = A(\eta_1) + A(\eta_2)\).
Finally, exponential family distributions have conjugate priors, i.e. priors for which the posterior distribution is in the same family as the prior. With such priors, the posterior predictive distribution always has a closed-form solution (provided that the normalizing factor can also be stated in closed form). Both are important properties for Bayesian statistics.
As an example, the beta distribution is the conjugate prior of the Bernoulli distribution. Consider a coin that lands heads with an unknown probability \(p\), a prior \(\operatorname{Beta}(\alpha, \beta)\) on \(p\), whose density is proportional to \(p^{\alpha-1}(1-p)^{\beta-1}\), and \(n_1\) heads in \(n\) tosses, whose likelihood is \(p^{n_1}(1-p)^{n-n_1}\). The posterior is proportional to their product, \(p^{\alpha+n_1-1}(1-p)^{\beta+n-n_1-1}\), i.e. it is the beta distribution \(\operatorname{Beta}(\alpha+n_1, \, \beta+n-n_1)\).
Example: Bernoulli distribution
The Bernoulli distribution gives the outcome \(x = 1\) the probability \(p\) and the outcome \(x = 0\) the probability \(1-p\), i.e. the probability \(p^x (1-p)^{1-x}\) for an outcome \(x \in \{0, 1\}\). Its exponential family parameters are computed as follows:
\[%% source: http://www.cs.columbia.edu/~jebara/4771/tutorials/lecture12.pdf \begin{align*} p^x (1-p)^{1-x} & = \exp \left( \log (p^x (1-p)^{1-x}) \right) \hspace{0.5cm}, x \in \{0,1\} \\ & = \exp \left( x \log p + (1-x) \log (1-p) \right) \\ & = \exp \left( x \log \frac{p}{1-p} + \log (1-p) \right) \\ & = \exp \left( x \eta - \log (1+e^\eta) \right) \\ \end{align*}\]where:
- \(h(x) = 1\),
- \(T(x) = x\),
- \(\eta = \log \frac{p}{1-p}\),
- \(A(\eta) = \log ( 1+e^\eta)\).
The mean of \(T(x)\) is now computed as:
\[\begin{align*} \frac{d A}{d \eta} = \frac{e^\eta}{1+e^\eta} = \frac{1}{1 + e^{-\eta}} = p \\ \end{align*}\]which is the mean \(p\) of a Bernoulli variable. Taking a second derivative yields:
\[%% source: https://people.eecs.berkeley.edu/~jordan/courses/260-spring10/other-readings/chapter8.pdf \frac{d^2A}{d\eta^2} = \frac{d p}{d \eta} = p (1-p)\]which is the variance of a Bernoulli variable.
The natural parameter of the Bernoulli distribution is the logit of \(p\), i.e. the logarithm of its odds, and the inverse mapping, \(p = 1/(1 + e^{-\eta})\), is the logistic function, also called the sigmoid. This is the base of logistic regression, which models the natural parameter of a binary output as a linear function of the input, so that the probability of the outcome 1 is the logistic function of that linear function.
The generalized linear models (GLM) extend this idea to the other members of the family: e.g. Poisson regression models the natural parameter of a count, \(\log \lambda\), as a linear function of the input, and linear regression models the mean \(\mu\) of a Gaussian output. Similarly, for a categorical output with \(k\) classes, the inverse mapping from the natural parameters \(\eta_1, \dots, \eta_k\) to the probabilities of the classes is the softmax function, \(p_i = e^{\eta_i} / \sum_{j=1}^k e^{\eta_j}\), the output layer of multinomial logistic regression and of neural network classifiers.
Example: Univariate Gaussian distribution
The univariate Gaussian distribution has two parameters, and its sufficient statistic is a vector of two components. It is defined for an input \(x\) as:
\[p(x \mid \mu, \sigma^2 ) = \frac{1}{ \sqrt{2 \pi \sigma^2} } \,\, \exp \left( - \frac{(x - \mu)^2}{2 \sigma^2} \right)\]for a distribution with mean \(\mu\) and standard deviation \(\sigma\). By moving the terms around, the density can be written as:
\[\begin{align*} %% source: http://www.cs.columbia.edu/~jebara/4771/tutorials/lecture12.pdf p(x \mid \mu, \sigma ) & = \frac{1}{ \sqrt{2 \pi \sigma^2} } \,\, \exp \left( - \frac{(x - \mu)^2}{2 \sigma^2} \right) \\ & = \frac{1}{ \sqrt{2 \pi } } \,\, \exp \left( - \log \sigma - \frac{x^2}{2 \sigma^2} + \frac{\mu x}{\sigma^2} - \frac{\mu^2}{2 \sigma^2} \right) \\ & = \frac{1}{ \sqrt{2 \pi } } \,\, \exp \left( \eta(\theta)^TT(x) - \log \sigma - \frac{\mu^2}{2\sigma^2} \right) \\ & = h(x) \,\, \exp \left( \eta(\theta)^TT(x) - A(\theta) \right) \\ \end{align*}\]where:
- \(h(x) = \frac{1}{ \sqrt{2 \pi}}\),
- \(T(x) = \begin{bmatrix} x \\ x^2 \end{bmatrix}\),
- \(\eta(\theta) = \begin{bmatrix} \mu/\sigma^2 \\ -1/(2\sigma^2) \end{bmatrix}\),
- \(A(\eta) = \frac{\mu^2}{2\sigma^2} + \log \sigma = - \frac{ \eta^2_1}{4 \eta_2} - \frac{1}{2} \log(-2\eta_2)\).
The first and second derivatives of \(A(\eta)\) are now used to compute the mean and the variance of the sufficient statistic \(T(x)\):
\[\begin{align*} %% source: https://people.eecs.berkeley.edu/~jordan/courses/260-spring10/other-readings/chapter8.pdf \frac{dA}{d\eta_1} & = \frac{d}{d\eta_1} \left( - \frac{ \eta^2_1}{4 \eta_2} - \frac{1}{2} \log(-2\eta_2) \right) \\ & = -\frac{\eta_1}{2\eta_2} \\ & = \frac{\mu / \sigma^2}{1/\sigma^2} \\ & = \mu \\ \end{align*}\]which is the mean of \(x\), the first component of the sufficient statistic. Taking the second derivative yields:
\[%% source: https://people.eecs.berkeley.edu/~jordan/courses/260-spring10/other-readings/chapter8.pdf \frac{d^2A}{d\eta_1^2} = - \frac{1}{2\eta_2} = \sigma^2\]which is the variance of the normal distribution, by definition.
Maximum Likelihood
The Maximum Likelihood Estimator (MLE) generalizes to all distributions of the exponential family.
As in the Gaussian case, the computation of the MLE starts by applying the log-trick to the general expression of the exponential family, which gives the following log-likelihood \(\ell(\eta \mid X)\) for the complete dataset \(X=(x_1, x_2, ..., x_N)\) of \(N\) independent samples:
\[%% source: http://www.cs.columbia.edu/~jebara/4771/tutorials/lecture12.pdf \begin{align*} \ell(\eta \mid X) &= \log p(X \mid \eta) \\ & = \log \left( \prod_{i=1}^N h(x_i) \exp \left(\eta^T T(x_i) -A(\eta) \right) \right) \\ & = \log \left( \prod_{i=1}^N h(x_i) \right) + \eta^T \left( \sum_{i=1}^N T(x_i) \right) - NA(\eta) \\ %\log p(x \mid \eta) & = \sum_{i=1}^N \log p(x_i \mid \theta) \\ % & = \sum_{i=1}^M \log \left( h(x_i) \exp \left(\eta(\theta)^T T(x_i) -A(\theta) \right) \right) \\ % & = \sum_{i=1}^N \left( \log h(x_i) + \eta(\theta)^T T(x_i) - A(\theta) \right) \\ % & = \sum_{i=1}^N \left( \log h(x_i) + \eta(\theta)^T T(x_i) \right) - NA(\theta) \\ \end{align*}\]The derivative with respect to \(\eta\) is then computed and set to zero, which gives the maximum likelihood estimate of the mean parameter \(\boldsymbol{\mu} = \mathbb{E}[T(X)]\), the vector of the means of the components of \(T(X)\): \(\boldsymbol{\mu} = (\mu, \mu^2 + \sigma^2)\) for the Gaussian, the means of \(x\) and \(x^2\), and \(\boldsymbol{\mu} = p\) for the Bernoulli:
\[%% source: http://www.cs.columbia.edu/~jebara/4771/tutorials/lecture12.pdf \begin{align*} & \frac{d}{d \eta} \ell(\eta \mid X) = 0 \\ \Leftrightarrow & \sum_{i=1}^N T(x_i) - N \nabla_\eta A (\eta) =0 \\ \Leftrightarrow & \nabla_\eta A (\eta) = \frac{1}{N} \sum_{i=1}^N T(x_i)\\ \Leftrightarrow & \boldsymbol{\mu}_{MLE} = \frac{1}{N} \sum_{i=1}^N T(x_i) \\ & \qquad \text{(from above: } \frac{dA(\eta)}{d \eta} = \mathbb{E}[T(X)] \text{ and } \mathbb{E}[T(X)] = \boldsymbol{\mu} \text{)} \\ \end{align*}\]This stationary point is a maximum. The second derivative of the log-likelihood with respect to \(\eta\) is \(-N \frac{d^2A}{d\eta \, d\eta^T} = -N \operatorname{Var}[T(X)]\), and a covariance matrix is positive semi-definite. Therefore, \(A(\eta)\) is a convex function, the log-likelihood is a concave function of \(\eta\), and its stationary point is its global maximum.
Not surprisingly, the result relates to the data only via the sufficient statistic \(\sum_{i=1}^N T(x_i)\), giving a meaning to the notion of sufficiency: to estimate parameters, only the sufficient statistic is retained. For distributions in which \(T(x) = x\), which include the Bernoulli, Poisson and multinomial distributions, it shows that the sample mean is the maximum likelihood estimate of the mean. For the univariate Gaussian distribution, the sample mean is the maximum likelihood estimate of the mean and the sample variance (with the factor \(1/N\), not \(1/(N-1)\)) is the maximum likelihood estimate of the variance.