Statistics for ML
Probability and statistics describe the uncertainty in ML: the data are samples of a distribution, a model predicts probabilities, and its parameters are estimated from the data. The summary below covers the topics that ML engineers use daily, from the books in the resources section.
Probability
Basic definitions
The sample space \(Ω\) is the set of all possible outcomes of an experiment. The event space \(\mathcal{A}\) is the space of potential results of the experiment, i.e. a σ-algebra of subsets of \(Ω\) (the events) to which probabilities are assigned. The probability of \(A\), or \(P(A)\), is the degree of belief that the event \(A\) will occur, in the interval \([0,1]\).
A random variable is a function \(X : Ω → T\) that takes an outcome in \(Ω\) and returns a particular quantity of interest \(x\) in the target space \(T\). Note: the name “random variable” creates confusion because it is neither random nor a variable: it is a function! For example, in the case of tossing two coins and counting the number of heads, a random variable \(X\) maps the four possible outcomes to three values: \(X(hh) = 2\), \(X(ht) = 1\), \(X(th) = 1\), and \(X(tt) = 0\).
Statistical distributions
Statistical distributions can be either continuous or discrete. Most of the commonly used parametric continuous distributions belong to the exponential family of distributions.
\(p(x)\) is called a probability mass function (pmf) or a probability density function (pdf) for a discrete or continuous variable \(x\), respectively. Any function over a discrete (continuous) domain can be a probability distribution, as long as it only has non-negative values and all values sum (integrate) to 1. The cumulative distribution function (cdf) is
\[P(X \le x) = \int^x_{-\infty} p(t) dt\]and there are cdfs which do not have a corresponding pdf. The probability of a subset/range of values is the sum of the probabilities of all its values, i.e. \(P( a \le X \le b) = \int^b_a p(t) dt\), or the equivalent sum for the discrete case.
The pdf of the sum of independent random variables is the convolution of their pdfs. For each value \(v\) of \(Y\), the sum \(X+Y\) equals \(u\) only when \(X = u-v\). The pdf of the sum at \(u\) is then the integral, over all values of \(v\), of the pdf of \(Y\) at \(v\) times the pdf of \(X\) at \(u-v\):
\[p_{X+Y}(u) = \int_{-\infty}^{+\infty} p_X(u-v) \, p_Y(v) \, dv\]For discrete probabilities, the joint probability of \(x \in X\) and \(y \in Y\) (not necessarily independent) is \(P(X=x_i, Y=y_j) = \frac{n_{ij}}{N}\) for \(N\) observations, where \(n_{ij}\) is the number of observations with \(X = x_i\) and \(Y = y_j\), i.e. the \(ij\)-cell of their contingency table.
Sum rule
The sum rule (or marginalization property) states that the probability of \(x\) is the sum of all joint probabilities of \(x\) and another variable \(y\), i.e. \(p(x) = \sum_{y \in Y} p(x,y)\) in the discrete case and \(p(x) = \int_Y p(x,y) dy\) in the continuous case.
Product rule
The product rule relates the joint distribution and the conditional distribution, and states that every joint distribution can be factorized into two other distributions:
\[p(x,y) = p(y \mid x) p(x) = p( x \mid y) p(y)\]Bayes rule
Bayes rule describes the relationship between some prior knowledge \(p(x)\) about an unobserved random variable \(x\) and some relationship \(p(y \mid x)\) between \(x\) and a second variable \(y\):
\[p(x \mid y) = \frac{ p(y \mid x) p(x)}{p(y)}\]read as: \(\text{posterior} = \frac{\text{likelihood} \times \text{prior}}{\text{evidence}}\). It is derived from the product rule on both terms:
\[p(y \mid x) p(x) = p(x \mid y) p(y) \Leftrightarrow p(x \mid y) = \frac{p(y \mid x) p(x)}{p(y)}\]The evidence is the marginal likelihood \(p(y) = \int p(y \mid x) p(x) dx = \mathbb{E}_{x \sim p(x)}[ p(y \mid x)]\), i.e. the likelihood averaged over the prior. In ML, the posterior \(p(\theta \mid x)\) is the quantity of interest, as it tells what is known about the parameters \(\theta\) (i.e. their distribution) after observing the data \(x\), a sample of the population (given its likelihood and a known/estimated prior).
Moments and Independence
Expected Value
The expected value of a function \(g\) of a univariate random variable \(X\) is \(\mathbb{E}_X [g(x)] = \int_X g(x) p(x) dx\), or the equivalent weighted sum for the discrete case. For a multivariate random variable, seen as a finite set of univariate ones, i.e. \(X = \left[X_1, X_2, ..., X_D \right]\), it is:
\[\mathbb{E}_X [g(x)] = \left[ \mathbb{E}_{X_1} [g(x_1)], \mathbb{E}_{X_2} [g(x_2)], ..., \mathbb{E}_{X_D} [g(x_D)] \right] \in \mathbb{R}^D\]Covariance
The covariance of two random variables is the expected product of their deviations from their respective means, i.e.:
\[\begin{align*} \operatorname{Cov}[X,Y] & = \mathbb{E} \left[ (X- \mathbb{E}[X]) \, (Y- \mathbb{E}[Y]) \right] \\ & = \mathbb{E}\left[ XY - X\mathbb{E}[Y] - \mathbb{E}[X]Y + \mathbb{E}[X]\,\mathbb{E}[Y] \right] \\ & = \mathbb{E}[XY] - \mathbb{E}[X] \,\mathbb{E}[Y] - \mathbb{E}[X] \,\mathbb{E}[Y] + \mathbb{E}[X] \, \mathbb{E}[Y] \\ & = \mathbb{E}[XY] - \mathbb{E}[X] \,\mathbb{E}[Y] \end{align*}\]In the univariate case:
\[\operatorname{Cov}_{X,Y}[x,y] = \mathbb{E}_{X,Y} \left[ (x-\mathbb{E}_X[x]) (y-\mathbb{E}_Y[y]) \right] = \operatorname{Cov}_{Y,X}[y,x]\]and for multivariate random variables \(X\) and \(Y\) with states \(x \in \mathbb{R}^D\) and \(y \in \mathbb{R}^E\):
\[\operatorname{Cov}_{X,Y}[x,y] = \mathbb{E}[xy^{\intercal}] - \mathbb{E}[x] \,\mathbb{E}[y]^{\intercal} = \operatorname{Cov}[y,x]^{\intercal} \in \mathbb{R}^{D \times E}\]Variance
In the univariate case:
\[\operatorname{Var}_X[x] = \operatorname{Cov}_X[x,x] = \mathbb{E}_{X} \left[ (x-\mathbb{E}_X[x])^2 \right] = \mathbb{E}_X[x^2] - \mathbb{E}_X[x]^2\]and in the multivariate case:
\[\operatorname{Var}_X[x] = \operatorname{Cov}_X[x,x] = \mathbb{E}_X[(x-\mu)(x-\mu)^{\intercal} ] = \mathbb{E}_X[xx^{\intercal}] - \mathbb{E}_X[x] \, \mathbb{E}_X[x]^{\intercal}\]This is a \(D \times D\) matrix also called the Covariance Matrix of the multivariate random variable \(X\):
- it is symmetric and positive semidefinite;
- the diagonal terms are the variances \(\operatorname{Var}[x_i]\), i.e. the covariance of each random variable with itself;
- the off-diagonal terms are \(\operatorname{Cov}[x_i, x_j]\) for \(i,j = 1, ..., D\) and \(i \neq j\).
Law of total variance:
\[\operatorname{Var}[Y] = \mathbb{E} \left [ \operatorname{Var}[Y \mid X] \right] + \operatorname{Var}\left[ \mathbb{E}[Y \mid X] \right]\]In practice, the law splits the variance of \(Y\) into two parts. The first is the spread of \(Y\) for a given value of \(X\), averaged over \(X\), and the second is the spread of the conditional mean \(\mathbb{E}[Y \mid X]\) when \(X\) changes.
Correlation
Correlation between random variables is a measure of covariance standardized to a limited interval \([-1,1]\). It is computed from the covariance (matrix) as:
\[\operatorname{corr}[x,y] = \frac{\operatorname{Cov}[x,y]}{\sqrt{\operatorname{Var}[x] \operatorname{Var}[y]}} \in [-1, 1]\]Positive correlation means \(y\) tends to increase as \(x\) increases (1=perfect correlation). Negative means \(y\) tends to decrease as \(x\) increases. Zero means no linear correlation.
Rules of transformations of Random Variables
The expected value and the variance of the sum and of the difference of two random variables are given by:
\[\begin{align*} \mathbb{E}[x+y] & = \mathbb{E}[x] + \mathbb{E}[y] \\ \mathbb{E}[x-y] & = \mathbb{E}[x] - \mathbb{E}[y] \\ \operatorname{Var}[x+y] & = \operatorname{Var}[x] + \operatorname{Var}[y] + \operatorname{Cov}[x,y] + \operatorname{Cov}[y,x] \\ \operatorname{Var}[x-y] & = \operatorname{Var}[x] + \operatorname{Var}[y] - \operatorname{Cov}[x,y] - \operatorname{Cov}[y,x] \end{align*}\]For the affine transformation \(y = Ax + b\) of \(x\), where \(\mu\) is the mean vector and \(\Sigma\) is the covariance matrix of \(x\):
\[\begin{align*} \mathbb{E}[Ax+b] & = A \mathbb{E}[x] + b = A \mu + b \\ \operatorname{Var}[Ax+b] & = \operatorname{Var}[Ax] = A \operatorname{Var}[x] A^{\intercal} = A \Sigma A^{\intercal} \end{align*}\]Statistical Independence
Statistical independence of random variables \(X\) and \(Y\) holds iff \(p(x,y)=p(x)p(y)\). Independence implies \(p(y \mid x) = p(y)\), \(p(x \mid y) = p(x)\) and \(\mathbb{E}[xy] = \mathbb{E}[x] \, \mathbb{E}[y]\), thus:
\[\operatorname{Cov}_{X,Y}[x,y] = \mathbb{E}[xy] - \mathbb{E}[x] \, \mathbb{E}[y] = 0\]and thus:
\[\operatorname{Var}_{X,Y}[x+y] = \operatorname{Var}_X[x] + \operatorname{Var}_Y[y]\]Important: the converse does not hold, i.e. zero covariance (\(\operatorname{Cov}_{X,Y}[x,y]=0\)) does not mean independence!
Covariance only measures a linear dependence: e.g. \(Y = X^2\), for an \(X\) symmetric around 0, has zero covariance with \(X\), yet it is a function of \(X\).
Conditional Independence
Conditional independence of random variables \(X\) and \(Y\) given \(Z\), i.e. \(X \perp Y \mid Z\), holds iff \(p(x,y \mid z) = p(x \mid z) \, p(y \mid z)\) for all \(z \in Z\). Once \(z\) is known, \(y\) then gives no further information about \(x\), i.e. \(p(x \mid y, z) = p(x \mid z)\).
Distributions
Gaussian Distribution
The univariate Gaussian with mean \(\mu\) and variance \(\sigma^2\) is:
\[p(x \mid \mu, \sigma^2 ) = \frac{1}{ \sqrt{2 \pi \sigma^2} } \,\, \exp \left( - \frac{(x - \mu)^2}{2 \sigma^2} \right)\]and the multivariate Gaussian with mean vector \(\mu \in \mathbb{R}^D\) and covariance matrix \(\Sigma\) is:
\[p(x \mid \mu, \Sigma ) = (2 \pi)^{-\frac{D}{2}} \mid\Sigma\mid^{-\frac{1}{2}} \exp \left( -\frac{1}{2}(x-\mu)^{\intercal} \Sigma^{-1}(x-\mu) \right)\]The marginals and conditionals of multivariate Gaussians are also Gaussian. The joint (bivariate) Gaussian distribution of two jointly Gaussian random variables \(X\) and \(Y\) is:
\[p(x,y) = \mathcal{N} \left( \begin{bmatrix} \mu_x \\ \mu_y \end{bmatrix}, \begin{bmatrix} \Sigma_{xx} & \Sigma_{xy} \\ \Sigma_{yx} & \Sigma_{yy} \end{bmatrix} \right)\]The conditional is \(p(x \mid y) = \mathcal{N} ( \mu_{x \mid y} , \Sigma_{x \mid y})\), and the marginal is \(p(x) = \int p(x,y) dy = \mathcal{N} ( x \mid \mu_x, \Sigma_{xx})\). The conditional mean and covariance are given by \(\mu_{x \mid y} = \mu_x + \Sigma_{xy} \Sigma_{yy}^{-1} (y - \mu_y)\) and \(\Sigma_{x \mid y} = \Sigma_{xx} - \Sigma_{xy} \Sigma_{yy}^{-1} \Sigma_{yx}\) (The Matrix Cookbook, eq. 353). An illustration of a bivariate Gaussian is displayed below:
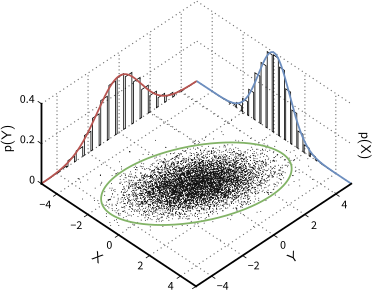
A bivariate Gaussian with mean \(\mu = (0, 0)\) and covariance entries \(\Sigma_{xx} = 1\), \(\Sigma_{xy} = \Sigma_{yx} = 0.6\) and \(\Sigma_{yy} = 2\). Dots: samples from the joint density \(p(x,y)\). Green: the 3σ ellipse of the joint density. Blue: the marginal density \(p(x)\). Red: the marginal density \(p(y)\). The bars are histograms of the samples. A conditional distribution, a slice of the joint density along \(x\) or \(y\), is also Gaussian. Adapted from: Multivariate normal distribution
The product of two Gaussian pdfs \(\mathcal{N} (x \mid a, A) \, \mathcal{N}(x \mid b, B)\) is a Gaussian scaled by a constant \(c \in \mathbb{R}\).
If \(X,Y\) are independent univariate Gaussian random variables with means \(\mu_x, \mu_y\) and variances \(\sigma_x^2, \sigma_y^2\), then \(p(x,y)=p(x) p(y)\), and \(x+y \sim \mathcal{N}(\mu_x + \mu_y, \sigma_x^2 + \sigma_y^2)\). For the weighted sum, \(ax + by \sim \mathcal{N}(a\mu_x + b\mu_y, a^2 \sigma_x^2 + b^2 \sigma_y^2)\).
Any linear/affine transformation of a Gaussian random variable is also Gaussian. With the rules of transformations above, \(y = Ax\) has the distribution \(p(y) = \mathcal{N}(y \mid A\mu, A \Sigma A^{\intercal})\). These closed forms, together with the central limit theorem below, make the Gaussian the default choice for the noise, the priors and the latent variables of many models.
The sum of the squares of \(n\) independent standard Gaussians \(Z_i \sim \mathcal{N}(0,1)\) follows a Chi-Square distribution with \(n\) degrees of freedom: \(Z_1^2 + Z_2^2 + ... + Z_n^2 \sim \chi_n^2\).
Conjugacy
If the posterior distribution \(p(\theta \mid x)\) is in the same probability distribution family (not necessarily the same distribution) as the prior \(p(\theta )\), the prior and posterior are called conjugate distributions. The prior is then called a conjugate prior for the likelihood function \(p(x\mid \theta )\). A conjugate prior is an algebraic convenience, giving a closed-form expression for the posterior; otherwise, numerical integration may be necessary. Every member of the exponential family has a conjugate prior, e.g. the Beta distribution for the Bernoulli distribution (MML book, Example 6.12).
As an example, with a \(\text{Beta}(\alpha, \beta)\) prior for the probability \(\theta\) of heads of a coin, \(h\) heads and \(t\) tails give the posterior \(\text{Beta}(\alpha + h, \beta + t)\): the data only add their counts to the parameters of the prior.
Exponential Family
The exponential family is the family of distributions that can be expressed in the form:
\[p(x \mid \theta) = h(x) \exp \left(\eta(\theta)^{\intercal} ϕ(x) -A(\theta)\right)\]where:
- \(θ\) are the parameters of the family;
- \(A(θ)\) is the log-partition function, a normalization constant that ensures that the distribution sums up or integrates to one;
- \(ϕ(x)\) is a sufficient statistic of the distribution;
- \(\eta\) is the natural parameter.
Information about data (population) can be captured in \(ϕ(x)\). Sufficient statistics carry all the information needed to make inference about the population, that is, they are the statistics that are sufficient to represent the distribution.
The Fisher-Neyman theorem states: Let \(X\) have probability density function \(p(x \mid θ)\). Then the statistics \(ϕ(x)\) are sufficient for \(θ\) if and only if \(p(x \mid θ)\) can be written in the form \(p(x \mid \theta) = h(x) g_{\theta}(ϕ(x))\). Here, \(h(x)\) is a non-negative function independent of \(θ\), and \(g_θ\) captures all the dependence on \(θ\) via the sufficient statistics \(ϕ(x)\). Note that the form of the exponential family is essentially a particular expression of \(g_θ(ϕ(x))\) in the Fisher-Neyman theorem.
As an intuition, the family can be seen as \(p(x \mid \eta) \propto \exp(\eta^{\intercal} ϕ(x))\), ignoring \(h(x)\) and the normalization \(A(\eta)\) (MML book, section 6.6.3). An alternative notation in natural form is \(p(x \mid \eta) = h(x) \exp \left(\eta^{\intercal} T(x) -A(\eta)\right)\), where \(T(x)\) is the sufficient statistic \(ϕ(x)\).
Why use the exponential family:
- they have finite-dimensional sufficient statistics;
- conjugate distributions are easy to write down, and the conjugate distributions also come from an exponential family;
- Maximum Likelihood Estimation behaves nicely because empirical estimates of sufficient statistics are optimal estimates of the population values of sufficient statistics (recall the mean and covariance of a Gaussian);
- from an optimization perspective, the log-likelihood function is concave in the natural parameters, allowing for efficient optimization approaches to be applied.
Moment Generating Function
The moment generating function is an alternative formulation of a pmf or pdf \(p(x)\):
\[M(t) = \mathbb{E} \left[ e^{tX} \right]\]i.e. \(\sum_{x \in S} e^{tx}\, p(x)\) for a pmf, or \(\int e^{tx}\, p(x) \, dx\) for a pdf. Its name comes from its derivatives at \(t=0\), which are the moments \(\mathbb{E}[X^k]\) of \(X\), e.g. the mean for \(k=1\). As the derivative of order \(k\) of \(e^{tX}\) with respect to \(t\) is \(X^k e^{tX}\), it follows that \(M^{(k)}(0) = \mathbb{E}[X^k]\). If the random variables are independent, \(M_{X+Y}(t) = M_X(t) \, M_Y(t)\). It can be used to show e.g. that the sum of independent Gaussians is a Gaussian.
Limit Theorems and Inequalities
Law of Large Numbers
Let \(Y_n\) be iid random variables (of any form) with \(\mathbb{E}[Y_k]=\mu\) for all \(k\). Then \(\frac{1}{n} (Y_1 + ... + Y_n) \rightarrow \mu\). In practice, this is why the average loss of a given model over many samples approximates its expected loss over the data distribution.
Central Limit Theorem
Let \(\{ Y_n \}\) be a sequence of iid random variables (of any form) with mean \(\mu\) and variance \(\sigma^2\). Then:
\[\sqrt{n} \left( \frac{1}{n} \sum_{i=1}^n (Y_i - \mu) \right) \rightarrow \mathcal{N}(0, \sigma^2)\]Thus, the mean of \(n\) iid samples is approximately Gaussian, whatever their distribution, with mean \(\mu\) and standard deviation \(\sigma / \sqrt{n}\), the standard error of the mean. This is the basis of the confidence intervals of the Testing section.
Inequality rules
Jensen’s inequality, where \(f\) is a convex function:
\[f (\mathbb{E}[X]) \le \mathbb{E}[ f(X)]\]As an example, for \(f(x) = x^2\) it gives \(\mathbb{E}[X]^2 \le \mathbb{E}[X^2]\), which is why the variance \(\operatorname{Var}[X] = \mathbb{E}[X^2] - \mathbb{E}[X]^2\) is never negative.
Markov’s inequality, where \(X\) is non-negative and \(\epsilon \gt 0\):
\[P(X \ge \epsilon) \le \frac{\mathbb{E}[X]}{\epsilon}\]Chebyshev’s inequality:
\[P \left( \vert X - \mathbb{E}[X] \vert \ge \epsilon \right) \le \frac{\operatorname{Var}[X]}{\epsilon^2}\]It holds for every distribution, so it is loose for most of them.
Cauchy-Schwarz inequality:
\[\operatorname{Var}[X] \, \operatorname{Var}[Y] \ge \operatorname{Cov}^2[X,Y]\]ELBO inequality, for any distribution \(q_{\phi}(z)\) of the latent variables \(z\), where the left-hand side is the log evidence \(\ln p_{\theta}(x)\), and the right-hand side is the evidence lower bound (ELBO) for \(x\). Here, \(\theta\) are the parameters of the model and \(\phi\) the variational parameters of \(q_{\phi}\). This bound follows from Jensen’s inequality with the convex function \(f(t) = -\ln t\), once the evidence is written as an expectation over \(q_{\phi}\):
\[\ln p_{\theta}(x) = \ln \int p_{\theta}(x, z) \, dz = \ln \mathbb{E}_{z \sim q_{\phi}} \left[ \frac{p_{\theta}(x, z)}{q_{\phi}(z)} \right] \ge \mathbb{E}_{z \sim q_{\phi}} \left[ \ln \frac{p_{\theta}(x, z)}{q_{\phi}(z)} \right]\]Testing
The quantile is the inverse of the cdf. It gives the point at which the cdf (or the integral of the pdf) equals a given value \(u \in [0,1]\), e.g. the median for \(u = 0.5\). The p-value (or observed significance level) is the smallest value of \(α\) for which the null hypothesis would be rejected at level \(α\) (the probability of rejecting the null hypothesis when it is true). In practice, the p-value is the probability, under the null hypothesis, of a result at least as extreme as the one observed.
The confidence interval refers to a set of values, computed from the data, that contains the population parameter for a certain proportion of times when the experiment is repeated. For example, for a \(95\%\) confidence level:
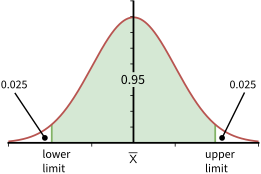
A 95% confidence interval for a normally distributed estimate centred at \(\bar{X}\): the lower and upper limits lie 1.96 standard errors either side of \(\bar{X}\), so the interval holds a probability of 0.95, and each tail 0.025.
As the standard error falls with \(\sqrt{n}\), so does the interval: a test set four times larger gives an interval half as wide.
Information Theory
Entropy
Entropy measures the average level of surprise or uncertainty inherent to the possible outcomes of a random variable:
\[H(X) = -\int_{x} p(x)\log p(x) dx=\mathbb {E} [-\log p(x)]\]For a discrete random variable, the integral is a sum, \(H(X) = -\sum_x p(x) \log p(x)\). With the logarithm in base 2, the entropy is measured in bits, and with the natural logarithm in nats. A fair coin has an entropy of 1 bit, and a biased coin less, as its outcome is less of a surprise.
Conditional Entropy:
\[H( Y \mid X) = - \int_x p(x) \int_y p(y \mid x) \log p(y \mid x) \,dy\,dx\]Joint Entropy:
\[H(X, Y) = - \int_{xy} p(x,y) \log p(x,y) \,dx\,dy\]Entropy Chain Rule:
\[H(X,Y) = H(X) + H(Y \mid X) = H(Y) + H(X \mid Y)\]Kullback–Leibler (KL) divergence
The KL divergence measures how much a distribution \(q\) differs from a reference distribution \(p\), and is defined as:
\[KL ( p \| q ) = \int_\mathbb{R} p(x) \log \frac{p(x)}{q(x)} dx\]From Jensen’s inequality, it follows that:
\[KL ( p \| q ) = \mathbb{E} \left[ - \log \frac{q(X)}{p(X)} \right] \ge -\log \mathbb{E} \left[ \frac{q(X)}{p(X)} \right] =0\]The KL divergence is not a metric because it is not symmetric: \(KL ( q \| p ) \neq KL ( p \| q )\). Also, \(p=q \Leftrightarrow KL ( q \| p ) = 0\).
By the product rule, \(p_{\theta}(x,z) = p_{\theta}(z \mid x) \, p_{\theta}(x)\), so the gap between the two sides of the ELBO inequality is a KL divergence:
\[\ln p_{\theta}(x) - \text{ELBO} = \mathbb{E}_{z \sim q_{\phi}} \left[ \ln \frac{q_{\phi}(z)}{p_{\theta}(z \mid x)} \right] = KL \left( q_{\phi}(z) \Vert p_{\theta}(z \mid x) \right)\]Thus, the ELBO equals the log evidence only when \(q_{\phi}(z)\) is the posterior \(p_{\theta}(z \mid x)\), and maximizing the ELBO over \(\phi\) brings \(q_{\phi}\) closer to the posterior. This is the idea behind variational inference.
Cross-Entropy
The cross-entropy of a distribution \(q\) relative to a reference distribution \(p\) is the expected value, under \(p\), of the surprise \(-\log q(x)\). It splits into the entropy of \(p\) and the KL divergence:
\[H(p, q) = -\mathbb{E}_{x \sim p} \left[ \log q(x) \right] = -\mathbb{E}_{x \sim p} \left[ \log p(x) \right] + \mathbb{E}_{x \sim p} \left[ \log \frac{p(x)}{q(x)} \right] = H(p) + KL(p \Vert q)\]Note that \(H(p, q)\), a function of two distributions, differs from the joint entropy \(H(X, Y)\) of two random variables. As \(H(p)\) does not depend on \(q\), minimizing the cross-entropy over \(q\) minimizes \(KL(p \Vert q)\). This is why the cross-entropy is the loss of classification models, where \(p\) is the distribution of the labels and \(q\) the prediction of the model.
Mutual Information
Mutual information measures the reduction in uncertainty for one variable given a known value of the other variable:
\[\begin{align*} I(X,Y) & = \int_{x,y} p(x,y) \log \frac{p (x,y)}{p(x) \, p(y)} dx\,dy = \mathbb{E} \left[ KL \left( p(x \mid y) \,\|\, p(x) \right) \right] \\ I(X,Y) & = H(Y) - H(Y \mid X) = H(X) - H(X \mid Y) \end{align*}\]The first integral is the KL divergence between the joint distribution and the product of the marginals, \(I(X,Y) = KL \left( p(x,y) \Vert p(x) \, p(y) \right)\). Thus, the mutual information is non-negative, and zero only when \(X\) and \(Y\) are independent.
Combinatorics and Sets
Arrangements
Arrangements of \(k\) items out of a set of size \(n\):
- Arrangement is the arrangement of some items in which order matters: \(^nA_k=n^k\) with replacement or \(\frac{n!}{(n-k)!}\) without.
- Permutation is the arrangement of all items in which order matters: \(^nP_n = n!\), the case \(k=n\) of \(^nP_k=\frac{n!}{(n-k)!}\).
- Combination is the arrangement of some items in which order does not matter (without replacement): \(\binom nk = \, ^nC_k = \frac{1}{k!} ^nP_k = \frac{n!}{k!(n-k)!}\).
Sets
The union of two subsets is written as \(F_1 \cup F_2 = \{ ω ∈ Ω : ω ∈ F_1 \text{ or } ω ∈ F_2 \}\), and the intersection is \(F_1 ∩ F_2 = \{ ω ∈ Ω : ω ∈ F_1 \text{ and } ω ∈ F_2 \}\). Two events \(F_1\) and \(F_2\) are disjoint if they have no elements in common, or \(F_1 ∩ F_2 = ∅\).
The complement of \(F\) is written as \(F^c\) and contains all elements of \(\Omega\) that are not in \(F\), i.e. \(F^c = \{ ω ∈ Ω : ω \not\in F \}\). From this, \(F ∪ F^c = Ω\).
A partition \(\{ F_n \}\) for \(n \ge 1\) is a collection of events such that \(F_i ∩ F_j = ∅\) for all \(i \neq j\) and \(\cup_{n≥1} F_n = Ω\). The difference between \(F_1\) and \(F_2\) is defined as \(F_1 \backslash F_2 = F_1 ∩ F_2^c\).
The following properties hold:
- associativity: \((F_1 ∪ F_2) ∪ F_3 = F_1 ∪ (F_2 ∪ F_3) = F_1 ∪ F_2 ∪ F_3\)
- associativity: \((F_1 ∩ F_2) ∩ F_3 = F_1 ∩ (F_2 ∩ F_3) = F_1 ∩ F_2 ∩ F_3\)
- distributivity: \(F_1 ∩ (F_2 ∪ F_3) = (F_1 ∩ F_2) ∪ (F_1 ∩ F_3)\)
- distributivity: \(F_1 ∪ (F_2 ∩ F_3) = (F_1 ∪ F_2) ∩ (F_1 ∪ F_3)\)
- De Morgan’s Laws: \((F_1 ∪ F_2)^c = F^c_1 ∩ F^c_2\) and \((F_1 ∩ F_2)^c = F^c_1 ∪ F^c_2\)
Using these properties and the axioms of probability, it can be shown that:
\[\begin{align*} & P(F_1 ∪ F_2) = P(F_1) − P(F_1 ∩ F_2) + P(F_2) \\ & P(F_1 ∩ F_2) ≤ \min\{P(F_1), P(F_2)\} \\ & F ∪ F^c = Ω, \quad 1 = P(Ω) = P(F) + P(F^c), \text{ thus } P(F^c) = 1 − P(F) \end{align*}\]Bayesian Networks
A Bayesian network is a probabilistic model for which a directed acyclic graph (DAG) expresses the conditional dependence structure between random variables (a causal model when the edges represent direct causes). The model represents a factorization of the joint probability of all random variables:
\[p(X_1,\ldots ,X_n) =\prod_{i=1}^{n} p \left( X_i \mid \text{pa}(X_i) \right)\]where \(\text{pa}(X_i)\) are the parents of \(X_i\). Example:
\[p(A,B,C,D) = p(A)\cdot p(B \mid A) \cdot p( C \mid A) \cdot p ( D \mid A,C )\]The following diagram illustrates the corresponding graph, with an arrow from each parent to its child:

Adapted from: Graphical model
Non-parametric Statistics (Smoothing)
A Kernel Density Estimator is used to convert a discrete distribution into a continuous distribution. Formulation: given a discrete cumulative distribution function (the empirical distribution function) with \(n\) steps at \(Y_1, ..., Y_n\), defined as:
\[\hat{F}_n (y) = \frac{1}{n} \sum_{i=1}^{n} \mathbb{1}(Y_i \le y)\]the kernel density estimator \(\hat{f}\) is the random density function:
\[\hat{f}(x) \, = \, \frac{1}{nh} \sum_{i=1}^n K \left( \frac{x-Y_i}{h} \right)\]where \(K\) is the kernel, a non-negative function that integrates to 1, and \(h \gt 0\) is the smoothing parameter (bandwidth). \(h\) regulates the bias-variance trade-off: a large vs. small \(h\) yields a flat vs. wiggly estimator. An example of \(K\) is the standard normal pdf, as in the following picture:
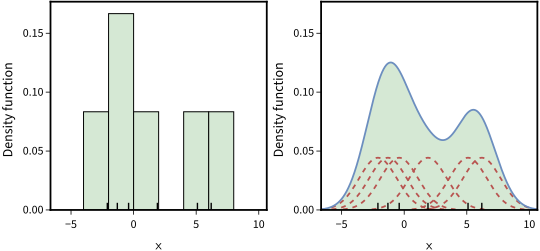
Histogram with bins of width 2 (left) and Gaussian kernel density estimate with bandwidth \(h = 1.5\) (right) of the same six data points. The estimate is the sum of six kernels centered at the points, each divided by \(n\). Adapted from: Kernel density estimation
Compared to the histogram on the left, the kernel density estimate is smooth and converges faster to the true density of a continuous random variable.