Bayesian Linear Regression, Maximum Likelihood and Maximum a Posteriori
Bayesian methods model the relationship between an input and an output while providing a measure of uncertainty, or “how sure the model is”, based on the seen data. Unlike most commonly used frequentist methods, where the output of the method is a set of best-fit parameters, the output of a Bayesian regression is a probability distribution of each model parameter, called the posterior distribution.
In a Bayesian linear regression \(y = x^Tw + \epsilon\), the weights \(w\) are not constant values, but are drawn from probability distributions whose parameters are learned during training. The noise \(\epsilon \thicksim \mathcal{N}(0, \sigma^2)\) captures how noisy the data may be, and the inverse of its variance, \(\beta = 1/\sigma^2\), is called the noise precision.
This post derives the maximum likelihood and maximum-a-posteriori estimators of linear regression and the closed-form solution of Bayesian linear regression, and then covers online learning, the predictive distribution and the comparison of two Bayesian models by their evidence.
Bayes’ theorem
From the field of probability, the product rule states that \(p(A, B) = p(A) p(B\mid A)\). By symmetry, \(p(B,A) = p(B) p(A\mid B)\). By equating the right-hand sides of both equations and rearranging the terms, Bayes’ theorem is obtained:
\begin{equation} \text{posterior} = \frac{\text{likelihood}\, \times \, \text{prior}}{\text{evidence}} = p(A\mid B) = \frac{p(B\mid A) p(A)}{p(B)}\end{equation}
In Machine Learning, the interest is mostly in how the parameters of the model \(\theta\) relate to the data \(X\):
\[p(\theta \mid X) = \frac{p(X\mid \theta) p(\theta)}{p(X)} \propto p(X \mid \theta) p(\theta) \label{eq_prior_AB}\]where the evidence (or marginal likelihood) is
\[p(X) = \int p(X \mid \theta) p(\theta) d\theta = \mathbb{E}_{\theta}[ p(X \mid \theta) ]\]The idea behind Bayes’ theorem in ML is to invert the relationship between the parameters \(\theta\) and the data \(X\) to obtain the posterior: the model describes how likely the data is for given parameters, \(p(X \mid \theta)\), and Bayes’ theorem turns it into what the data says about the parameters, \(p(\theta \mid X)\).
In this post, the methods are based solely on the normal distribution, which models the prior, the likelihood and the posterior, and is defined for an input \(x\) by:
\[p(x \mid \mu, \sigma ) = \frac{1}{ \sqrt{2 \pi \sigma^2} } \,\, \exp \left( - \frac{(x - \mu)^2}{2 \sigma^2} \right)\]for a distribution with mean \(\mu\) and standard deviation \(\sigma\) in univariate notation, or
\[p(x \mid \mu, \Sigma ) = \left(\frac{1}{2 \pi}\right)^{D/2} \,\, \det(\Sigma)^{-1/2} \exp \left( - \frac{1}{2}(x - \mu)^T \Sigma^{-1} (x-\mu) \right)\]with mean vector \(\mu\) and covariance matrix \(\Sigma\) in its multivariate (matrix) notation, where \(D\) is the dimension of \(x\).
An important theorem, the Bernstein-von Mises theorem, states that, for a sufficiently large sample size, the posterior distribution becomes independent of the prior, as long as the prior density is continuous and positive at the true parameters. As the number of data points \(N\) goes to infinity, the posterior converges to a normal distribution centered at the maximum likelihood estimate (defined in the next section), with a variance that shrinks as \(1/N\): this is the Bayesian counterpart of the asymptotic normality of the maximum likelihood estimator. In practice, the effect of the prior decreases as the data increases, as the data then has enough information.
The goal is typically to maximize the posterior, so the evidence term can be dropped (as it is independent of \(\theta\)), and only the maximum of the term \(p(X \mid \theta) p(\theta)\) is computed.
There are two main optimization problems that this post discusses in Bayesian methods: Maximum Likelihood Estimator (MLE) and Maximum-a-Posteriori (MAP). Both return a single value of the parameters, a point estimate: the MLE maximizes the likelihood \(p(X \mid \theta)\) alone, while the MAP maximizes the product \(p(X \mid \theta) p(\theta)\) above, which includes the prior.
Maximum Likelihood Estimator (MLE)
(The appendix at the bottom of the page lists the rules used in the following derivations.)
Consider what the probability density \(p(y \mid X, w)\) is modeling for a fixed value of the weights \(w\), the parameters \(\theta\) of linear regression. It is a distribution that models the uncertainty of the data, the outputs \(y\) of the inputs \(X\), for a given parameter setting. In a complementary view, if the data is considered to be fixed (because it has been observed), and the weights \(w\) vary, the same function tells how likely a particular setting of \(w\) is for the observations. Seen as a function of \(w\), it is called the likelihood: \(p(y \mid X, w, \sigma^2)\) measures how likely it is for an output \(y\) to belong to a model defined by data \(X\), weights \(w\) and model parameters \(\sigma\) (if any).
Based on this second view, the Maximum Likelihood Estimator (MLE) gives the most likely parameter \(w\) for the set of data (MML book, section 8.3.1). Maximizing the likelihood means maximizing the probability of the training data, given the model parameters, as:
\[w_{MLE} = \arg\max_w p(y \mid X, w)\]To simplify the computation, the log-trick is performed, placing the term to optimize inside a log function. This is possible because \(\log\) is a monotonically increasing function, so applying it to any positive function does not change the input values at which the minimum or maximum is attained (i.e. where the gradient is zero). The data points \((x_n, y_n)\), where \(x_n^T\) is the \(n\)-th row of \(X\), are assumed to be independent and identically distributed (i.i.d.), so that the likelihood of the dataset is the product of the likelihoods of its points. Moreover, since the Gaussian likelihood is then a product of exponentials, applying the \(\log\) function brings the power term out of the exponential, making its computation simpler and faster. In practice, applying the log-trick to the function to be minimized gives:
\[\begin{align*} -\log p(y \mid X, w) & = -\log \prod_{n=1}^N p(y_n \mid x_n, w) \\ & = - \sum_{n=1}^N \log p(y_n \mid x_n, w)\\ \end{align*}\]I.e. a log of products turns into a sum of logs. In the linear regression model, the likelihood is Gaussian, due to the Gaussian noise term \(\epsilon \thicksim \mathcal{N}(0, \sigma^2)\). Therefore:
\[\begin{aligned} \log p(y_n \mid x_n, w, \sigma^2) & = \log \left( \frac{1}{ \sqrt{2 \pi \sigma^2} } \,\, \exp \left( - \frac{(y_n - x_n^Tw)^2}{2 \sigma^2} \right) \right)\\ & = - \frac{1}{2 \sigma^2} (y_n - x^T_n w)^2 + const \\ \end{aligned} \label{eq_lr_likelihood}\]where \(const\) includes all terms independent of \(w\). Using the negative of the previous log-likelihood, and ignoring the constants whose derivative is zero, gives the following loss function:
\[\begin{align*} L(w) & = \frac{1}{2 \sigma^2} \sum_{n=1}^N (y_n - x_n^Tw)^2 \\ & = \frac{1}{2 \sigma^2} (y - Xw)^T (y-Xw) \\ & = \frac{1}{2 \sigma^2} \| y-Xw \|^2 \\ \end{align*}\]The second trick here is that the previous equation is quadratic in \(w\). Thus, there is a unique global solution for minimizing the loss (as long as \(X^TX\) is invertible), and the point of minimum loss is computed as:
\[\begin{align*} & \frac{dL}{dw} = 0 \\ \Leftrightarrow & 0 = \frac{d}{dw} \left( \frac{1}{2 \sigma^2} (y-Xw)^T(y-Xw) \right) \\ \Leftrightarrow & 0 = \frac{1}{2 \sigma^2} \frac{d}{dw} \left( y^Ty - 2y^TXw + w^TX^TXw \right) \\ \Leftrightarrow & 0 = \frac{1}{2 \sigma^2} \left( -2y^TX + 2w^TX^TX \right) \\ \Leftrightarrow & y^TX = w^TX^TX \\ \Leftrightarrow & w^T = y^TX (X^TX)^{-1} \\ \Leftrightarrow & w_{MLE} = (X^TX)^{-1}X^Ty \\ \end{align*}\]Note that this solution is independent of the noise variance \(\sigma^2\), and matches the result of minimizing the Least Squares problem, as shown in a previous post, with the same closed-form solution \(w = (X^TX)^{-1} X^Ty\). In practice, minimizing the Least Squares problem is equivalent to determining the most likely \(w\) under the assumption that \(y\) contains Gaussian noise, i.e. \(y = Xw + \epsilon\), with \(\epsilon \thicksim \mathcal{N}(0, \sigma^2 I)\).
Adding regularization
Regularizers can be added as in non-Bayesian regression, and may also have an analytical solution. As an example, adding an \(L_2\)/Ridge regularizer gives:
\[\begin{align*} & 0 = \frac{d}{dw} \left( \log p(y \mid X, w) - \frac{\alpha}{2} w^Tw \right)\\ \Leftrightarrow & 0 = \frac{d}{dw} \left( - \frac{N}{2} \log ( 2 \pi \sigma^2) - \frac{1}{2 \sigma^2} (y-Xw)^T(y-Xw) - \frac{\alpha}{2} w^Tw \right)\\ \Leftrightarrow & w_{MLE\_reg} = (X^TX + \lambda I )^{-1} X^Ty\\ \end{align*}\]where \(\lambda = \alpha \sigma^2\); therefore, the solution is now noise-dependent, contrary to the previous case. Note that the regularizer constant \(\alpha/2\) was picked in the first step to simplify the math and cancel out the 2 when taking the derivative of \(w^Tw\).
Estimating noise variance
So far, the noise variance \(\sigma^2\) was assumed to be known. However, the same Maximum Likelihood principle can be used to obtain the estimator \(\sigma^2_{MLE}\) for the noise:
\[\begin{align*} \log p(y \mid X, w, \sigma^2) = & \sum_{n=1}^N \log \mathcal{N} (y_n \mid x_n^Tw, \sigma^2) \\ = & \sum_{n=1}^N \left( -\frac{1}{2} \log(2\pi) -\frac{1}{2} \log(\sigma^2) -\frac{1}{2 \sigma^2}(y_n-x_n^Tw)^2 \right)\\ = & -\frac{N}{2} \log \sigma^2 -\frac{1}{2 \sigma^2} \sum_{n=1}^N (y_n - x_n^Tw)^2 + const\\ \end{align*}\]The partial derivative of the log-likelihood with respect to \(\sigma^2\), and the MLE of \(\sigma^2\), are then:
\[\begin{align*} & \frac{d \log p(y \mid X, w, \sigma^2)}{d \sigma^2} = -\frac{N}{2 \sigma^2} + \frac{1}{2 \sigma^4} \sum_{n=1}^N (y_n - x_n^Tw)^2 = 0\\ \Leftrightarrow & \frac{N}{2 \sigma^2} = \frac{1}{2 \sigma^4} \sum_{n=1}^N (y_n - x_n^Tw)^2 \\ \Leftrightarrow & \sigma^2_{MLE} = \frac{1}{N} \sum_{n=1}^N (y_n - x_n^Tw)^2 \\ \end{align*}\]i.e. \(\sigma^2_{MLE}\) is the mean of the squared distances between the observations and the noise-free values \(x_n^Tw\), evaluated at the MLE of the weights, \(w = w_{MLE}\).
In linear regression, both estimators have a closed form: \(w_{MLE}\) does not depend on \(\sigma^2\), and \(\sigma^2_{MLE}\) follows from \(w_{MLE}\). When the likelihood (or, with a prior, the posterior) has no closed-form maximum, its parameters can be optimized with the coordinate ascent method. This iterative method updates one parameter (or block of parameters) at a time, while the other parameters stay fixed. In practice, each iteration computes the partial derivative of the log-likelihood (or log-posterior) with respect to one model parameter (e.g. the mean \(\mu\), then the standard deviation \(\sigma\), of a Gaussian) and moves that parameter in the direction that increases the log-likelihood, i.e. towards a lower loss.
Maximum-a-Posteriori (MAP)
Maximum likelihood without a regularizer is prone to overfitting. When overfitting occurs, the model runs into very large parameter values. To mitigate the effect of huge values, a prior can be placed on the parameter space, and the goal is now to find the parameters that maximize the posterior distribution.
If there is prior knowledge about the distribution of the parameters, the likelihood can be multiplied by an additional term. This additional term is a prior probability distribution on parameters. For a given prior, after observing some data, how should the distribution of the parameters be updated? In other words, how to represent the fact that the knowledge of the parameters is more specific after observing the data?
The answer is the posterior distribution, obtained by applying Bayes’ theorem, and the parameters at its maximum are the Maximum-a-Posteriori (MAP) estimate.
The problem at hand is to find the parameters of the distribution that best represent the data. Adapting equation \ref{eq_prior_AB} to the problem of regression, the aim is to compute:
\[p(w\mid X, y) = \frac{p(y\mid X, w) p(w)}{p(y \mid X)} \propto p(y\mid X, w) p(w) \label{posterior_w}\]The computation steps are similar to the log-trick applied in the MLE case. The log-posterior is then:
\[\log p(w\mid X, y) = \log p(y \mid X, w) + \log p(w) + const\]In practice, this is the sum of the log-likelihood \(\log p(y \mid X, w)\) and the log-prior \(\log p(w)\), so the MAP estimation is a compromise between the prior and the likelihood. An alternative view is the idea of regularization, which introduces an additional term that biases the resulting parameters to be close to the origin (MML book section 8.3.2). Similarly to the MLE, and for a prior \(\mathcal{N}(0, \sigma_w^2 I)\) on the weights, i.e. independent weights with zero mean and standard deviation \(\sigma_w\), the derivative of the negative log-posterior with respect to \(w\) is computed as:
\[\begin{align*} & - \frac{d \log p( w \mid X,y)}{dw} \\ = & - \frac{d \log p( y \mid X,w)}{dw} - \frac{d \log p(w)}{dw} \\ = & \frac{d}{dw} \left( \frac{1}{2 \sigma^2}(y-Xw)^T(y-Xw) \right) + \frac{d}{dw} \left( \frac{1}{2\sigma_w^2}w^Tw \right) \\ & \qquad \text{(Linear Reg. likelihood (eq \ref{eq_lr_likelihood}), and prior } \mathcal{N}(0, \sigma_w^2 I) \text{)} \\ = & \frac{1}{\sigma^2}(w^TX^TX-y^TX) + \frac{1}{\sigma_w^2}w^T \\ & \qquad \text{(First-order derivatives, rule 5)} \\ \end{align*} \label{eq_prior_w}\]Computing the minimum value:
\[\begin{align*} & \frac{1}{\sigma^2}(w^TX^TX-y^TX) + \frac{1}{\sigma_w^2}w^T = 0 \\ \Leftrightarrow & w^T \left( \frac{1}{\sigma^2}X^TX + \frac{1}{\sigma_w^2}I \right) - \frac{1}{\sigma^2}y^TX = 0\\ \Leftrightarrow & w^T \left( X^TX + \frac{\sigma^2}{\sigma_w^2}I \right) = y^TX \\ \Leftrightarrow & w^T = y^TX \left( X^TX + \frac{\sigma^2}{\sigma_w^2}I \right)^{-1} \\ \Leftrightarrow & w_{MAP} = \left( X^TX + \frac{\sigma^2}{\sigma_w^2}I \right)^{-1} X^Ty\\ \end{align*}\]This shows that the only difference between the weights estimated using MAP (\(w_{MAP}\)) and using MLE (\(w_{MLE}\)) is the additional term \(\frac{\sigma^2}{\sigma_w^2}I\) in the inverse matrix, acting as a regularizer. Note that \(w_{MAP}\) is the solution \(w_{MLE\_reg}\) of the \(L_2\) regularizer above, with \(\alpha = 1/\sigma_w^2\), the precision of the prior. This regularizer matters mostly for small datasets: \(X^TX\) grows with the number of data points while \(\frac{\sigma^2}{\sigma_w^2}I\) does not, so \(w_{MAP}\) tends to \(w_{MLE}\) as the data increases.
Closed-form solution for Bayesian Linear Regression
Instead of computing a point estimate via MLE or MAP, a special case of Bayesian inference is linear regression with normal priors and posterior. In this case, the posterior has an analytical solution, as the normal prior is a conjugate prior for the normal likelihood when the noise variance is known. This approach is used very commonly, mainly because the result is not an estimate, and the analytical solution for the posteriors is extremely fast to compute, even for very large datasets. Its cost, \(O(ND^2 + D^3)\), grows linearly with the number of data points \(N\) and cubically with the dimensionality \(D\).
Bayesian linear regression pushes the idea of the parameter prior a step further: it does not even attempt to compute a point estimate of the parameters, but takes their full posterior distribution into account when making predictions. This means that no parameters are fitted, and a mean over all plausible parameter settings (according to the posterior) is computed instead.
All weights are assumed to be drawn from a Gaussian distribution and can be independent (if the covariance matrix is diagonal) or not (otherwise). In practice, the starting point is the prior \(w \thicksim \mathcal{N}(m_0, S_0)\), with mean vector \(m_0\) and (positive definite) covariance matrix \(S_0\) (following the variable notation found in Chris Bishop’s PRML book).
The derivation below shows that the posterior is a normal distribution too, \(p(w \mid X, y) = \mathcal{N}(w \mid m_N, S_N)\), with:
\[S_N = \left( \sigma^{-2} X^TX + S_0^{-1} \right)^{-1} \quad \text{and} \quad m_N = S_N \left( \sigma^{-2} X^Ty + S_0^{-1} m_0 \right)\]In practice, the precision of the posterior (the inverse of its covariance), \(S_N^{-1}\), is the precision of the prior, \(S_0^{-1}\), plus the precision that the data brings, \(\sigma^{-2} X^TX\). Since \(X^Ty = X^TX w_{MLE}\), the posterior mean is a weighted average of the MLE \(w_{MLE}\) and of the prior mean \(m_0\), with these two precisions as weights.
The derivation starts from the prior in multivariate notation:
\[p(w \mid m_0, S_0 ) = (2 \pi)^{-\frac{D}{2}} \,\, \det(S_0)^{- \frac{1}{2}} \,\, \exp \left( - \frac{1}{2}(w - m_0)^T S_0^{-1} (w-m_0) \right)\]And the likelihood:
\[p(y \mid X, w) = \frac{1}{(2 \pi \sigma^2)^{N/2}} \exp \left( -\frac{1}{2 \sigma^2} (y-Xw)^T(y-Xw) \right)\]Going back to Equation \ref{posterior_w} and replacing the terms leads to:
\[\begin{align*} p(w \mid X, y) & = \frac{p(y\mid X, w) p(w)}{p(y \mid X )} \\ & \propto p(y\mid X, w) p(w) \\ & \qquad \text{(dropped constant term in division)} \\ & \propto \exp \left( -\frac{1}{2 \sigma^2} (y-Xw)^T(y-Xw) - \frac{1}{2}(w-m_0)^TS_0^{-1}(w-m_0) \right) \\ & \qquad \text{(dropped constant in multiplication)} \\ & = \exp \left( -\frac{1}{2} \left( \sigma^{-2} (y-Xw)^T(y-Xw) + (w-m_0)^TS_0^{-1}(w-m_0) \right) \right)\\ \end{align*}\]The log-trick is now applied and the expression factorized, so that the quadratic, linear and independent terms in \(w\) can be isolated:
\[\begin{align} & \log p(w \mid X, y) \\ = & -\frac{1}{2} (\sigma^{-2}(y-Xw)^T(y-Xw) + (w-m_0)^TS_0^{-1}(w-m_0)) + const \\ & \qquad \text{(ignore const due to zero-derivative)} \\ = & - \frac{1}{2} \left( \sigma^{-2} y^T y - 2\sigma^{-2} y^T Xw + \sigma^{-2} w^T X^T Xw + w^TS_0^{-1}w - 2 m_0^T S_0^{-1} w + m_0^T S_0^{-1} m_0 \right) \\ \label{eq1_sq} = & - \frac{1}{2} \left( w^T ( \sigma^{-2} X^TX + S_0^{-1}) w \right) & \hspace{2cm}\text{(terms quadratic in } w \text{)} \\ \label{eq1_lin} & + \left( \sigma^{-2} X^Ty + S_0^{-1} m_0 \right)^T w & \hspace{2cm}\text{(terms linear in } w \text{)} \\ & - \frac{1}{2} \left( \sigma^{-2} y^T y + m_0^T S_0^{-1} m_0 \right) & \hspace{2cm}\text{(const terms independent of } w \text{)} \\ \end{align}\]As a side note: the last equation shows that this function is quadratic in \(w\). The fact that the unnormalized log-posterior distribution is a negative quadratic implies that the posterior is Gaussian, i.e.:
\[\begin{align*} p(w\mid X, y) = & \exp ( \log p(w\mid X, y) ) \\ \propto & \exp ( \log p(y\mid X, w) + \log p(w) ) \\ & \qquad \text{(Bayes equation)} \\ \propto & \exp \left( -\frac{1}{2} w^T ( \sigma^{-2} X^TX + S_0^{-1}) w + \left( \sigma^{-2} X^Ty + S_0^{-1} m_0 \right)^T w \right) \\ & \qquad \text{(quadratic and linear terms of } \log p(w \mid X, y) \text{)} \\ \end{align*}\]where only the linear and quadratic terms in \(w\) are used, and the \(const\) terms are ignored: their exponential is a constant factor, which does not change the proportionality.
Going back to the main problem, this unnormalized Gaussian now needs to be brought into the form proportional to \(\mathcal{N} ( w \mid m_N, S_N )\). The method of completing the square is used to find the values of \(m_N\) and \(S_N\). The desired log-posterior is:
\[\begin{align} \log \mathcal{N} ( w \mid m_N, S_N ) = & -\frac{1}{2}(w - m_N)^T S_N^{-1}(w-m_N) + const \\ \label{eq2_sq} = & -\frac{1}{2} \left(w^T S_N^{-1}w \right) & \hspace{2cm}\text{(terms quadratic in } w \text{)} \\ \label{eq2_lin} & + m^T_N S^{-1}_N w & \hspace{2cm}\text{(terms linear in } w \text{)} \\ & - \frac{1}{2} \left( m_N^T S_N^{-1} m_N \right) & \hspace{2cm}\text{(const terms independent of } w \text{)} \\ \end{align}\]Thus, by matching the quadratic (\ref{eq1_sq}, \ref{eq2_sq}) and linear (\ref{eq1_lin}, \ref{eq2_lin}) expressions of the computed and desired equations, \(S_N\) and \(m_N\) are found as:
\[\begin{align*} & w^T S_N^{-1} w = \sigma^{-2} w^TX^TXw+w^TS_0^{-1} w \\ \Leftrightarrow & w^T S_N^{-1} w = w^T ( \sigma^{-2} X^TX+ S^{-1}_0) w \\ \Leftrightarrow & S_N^{-1} = \sigma^{-2} X^T X + S^{-1}_0 \\ \Leftrightarrow & S_N = ( \sigma^{-2} X^TX + S^{-1}_0)^{-1} \\ \end{align*}\]and
\[\begin{align*} & m_N^T S_N^{-1}w = (\sigma^{-2}X^Ty + S_0^{-1} m_0)^T w \\ \Leftrightarrow & m_N^T S_N^{-1} = (\sigma^{-2}X^Ty + S_0^{-1} m_0)^T \\ \Leftrightarrow & m_N = S_N (\sigma^{-2}X^Ty + S_0^{-1} m_0) \\ \end{align*}\]in line with equations 3.50 and 3.51 in Chris Bishop’s PRML book. Note that, for the prior \(m_0 = 0\) and \(S_0 = \sigma_w^2 I\) of the MAP estimation, the posterior mean \(m_N\) is the MAP estimate \(w_{MAP}\), as the mean and the mode of a Gaussian coincide. The full posterior adds the covariance \(S_N\), i.e. the uncertainty on the weights. In practice, since the MLE and MAP estimates also invert a \(D \times D\) matrix, the full posterior costs about as much as a point estimate, and it is the better choice when the predictions need a measure of uncertainty.
Online learning
Online learning allows the model to learn iteratively, by continuously updating its posterior based on newly observed data. The main idea is that, following the \(\text{posterior} \propto \text{likelihood} \times \text{prior}\) principle, at every iteration the posterior is turned into the new prior, i.e. the new initial knowledge is what was learned previously. The main advantage is that it does not require all the data at once for training, allowing the model to learn from datasets that are not fully available at once.
In the closed-form solution above, the \(m_N\) and \(S_N\) computed from one batch of data become the \(m_0\) and \(S_0\) of the next batch. The final posterior is the same as if all the data had been processed at once. An illustration of the principle is displayed below:
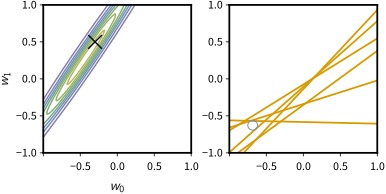
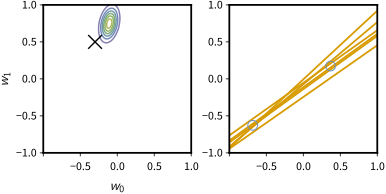
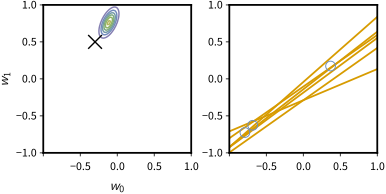
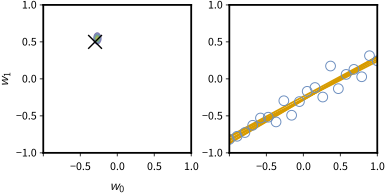
Online learning for the linear model \(y = w_0 + w_1x\), after 1, 2, 3 and 20 data points (the last update adds 17 points at once). Left: the posterior density of the weights \((w_0, w_1)\); the cross marks the true weights \((-0.3, 0.5)\). Right: the data points and six lines drawn from the posterior. Inspired by: Pattern Recognition and Machine Learning, C. Bishop, Figure 3.7
The model starts with the prior knowledge that both weights (the bias \(w_0\) and the slope \(w_1\)) are zero-centered, i.e. with mean 0 and a standard deviation of 1, and its likelihood uses the noise standard deviation of the data, \(\sigma = 0.1\). When a new data point is introduced (blue circle on the top-right plot), the new posterior (top-left) is computed from the likelihood and the initial prior. A single point only requires the line to pass close to it, so the posterior is stretched along a line of the plane of the weights. Drawing models from the current posterior thus leads to inaccurate regression models: the six orange lines on the top-right plot pass near the point, with very different slopes.
Another point is then introduced (second row, right), leading to a new posterior (second row, left), computed from the likelihood and the prior (i.e. the posterior of the previous iteration). The posterior is now much narrower, and the lines drawn from it pass close to both points. The true weights, marked by the cross, still lie outside its contours, as two noisy points still pull the posterior away from them. The third point (third row) lies close to the first one and changes the posterior little. The last update adds the 17 remaining points at once (bottom row): the posterior concentrates around the true weights, and the lines drawn from it almost coincide.
Predictive distribution
Remember that the goal was to model a noisy output defined by \(y_* = x_*^Tw + \epsilon\) for a new input \(x_*\) (a column vector, as the inputs \(x_n\)), with the noise \(\epsilon \thicksim \mathcal{N}(0, \sigma^2)\). The closed-form solution that computes the distribution of \(w\) was provided in a previous section. This section now computes the distribution of \(y_*\).
Note that, for a fixed \(w\), drawing samples from the likelihood \(p(y_* \mid x_*, w, \sigma^2)\) is equivalent to drawing samples from \(y_* = x_*^Tw + \epsilon\). With \(w\) drawn from its posterior \(\mathcal{N}(m_N, S_N)\), \(y_*\) follows the predictive distribution.
The expectation of \(y_*\) can then be computed as:
\[\begin{align*} \mathbb{E} \left[ y_* \right] & = \mathbb{E} \left[ x_*^Tw + \epsilon \right] \\ & = x_*^T \mathbb{E} \left[ w \right] + \mathbb{E} \left[ \epsilon \right] \\ & = x_*^T m_N \\ \end{align*}\]i.e. because the noise has zero mean, the result is equivalent to a linear regression where the weights are set to their posterior mean \(m_N\). The variance of \(y_*\) follows analogously (the variance rules are listed in the appendix):
\[\begin{align*} \operatorname{Var} \left[ y_* \right] & = \operatorname{Var} \left[ x_*^Tw + \epsilon \right] \\ & = \operatorname{Var} \left[ x_*^Tw \right] + \operatorname{Var} \left[ \epsilon \right] + 2\operatorname{Cov} \left[ x_*^Tw, \epsilon \right] \\ & = \operatorname{Var} \left[ x_*^Tw \right] + \operatorname{Var} \left[ \epsilon \right] \\ & \qquad \text{(independent variables)} \\ & = x_*^T \operatorname{Var} \left[ w \right] x_* + \operatorname{Var} \left[ \epsilon \right] \\ & \qquad \text{(Var linear transformation, rule 6)} \\ & = x_*^T S_N x_* + \sigma^2 & ( \epsilon \thicksim \mathcal{N}(0, \sigma^2 ) \text{ and noise variance } \sigma^2 \text{)}\\ \end{align*}\]In practice, the first term comes from the uncertainty on the weights, which decreases as new data points are introduced, and the second term is the noise of the data, which no amount of data can reduce. Since \(y_*\) is a linear function of the normal variables \(w\) and \(\epsilon\), which are independent, the predictive distribution is the normal distribution \(\mathcal{N}(y_* \mid x_*^Tm_N, \, x_*^TS_Nx_* + \sigma^2)\). Similarly to the visualization displayed before, introducing new data points improves the accuracy of the model, here fitted to sinusoidal data. The model only needs to be linear in \(w\), so the rows of \(X\) and the vector \(x_*\) can hold Gaussian basis functions of the input instead of the input itself, as in the following pictures:
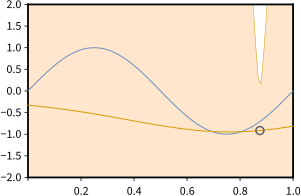
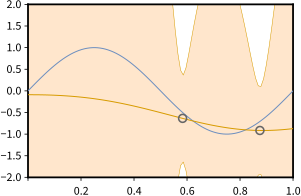
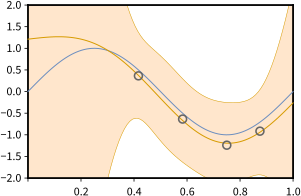
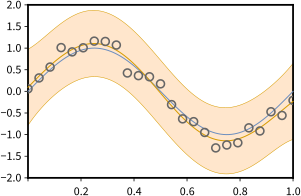
Bayesian linear regression of synthetic sinusoidal data with 9 Gaussian basis functions, after 1, 2, 4 and 25 data points. Each plot shows the data points as grey circles, the ground truth \(\sin(2 \pi x)\) in blue, the predictive mean in orange, and the predictive mean plus and minus one predictive standard deviation as a light-orange area. The model has a prior precision \(\alpha = 10^{-3}\) and a noise precision \(\beta = 2\). Inspired by: Pattern Recognition and Machine Learning, C. Bishop, Figure 3.8
Looking at the pictures above, the predictive standard deviation is smallest near the observed data points, where the first term \(x_*^T S_N x_*\) is small, and grows away from them. As more points are added, this term decreases, and the band tends to the width set by the noise variance \(\sigma^2\).
Comparing two Bayesian models
To compare two probabilistic models \(M_1,M_2\) given the same dataset \(\mathcal{D}\), the ratio of their posteriors is computed, a.k.a. the posterior odds:
\[\frac{p(M_1 \mid \mathcal{D})}{p(M_2 \mid \mathcal{D})} = \frac{ \frac{p(\mathcal{D} \mid M_1) \, p(M_1)}{p(\mathcal{D})} }{ \frac{p(\mathcal{D} \mid M_2) \, p(M_2)}{p(\mathcal{D})} } = \frac{p(\mathcal{D} \mid M_1) \, p(M_1)}{p(\mathcal{D} \mid M_2) \, p(M_2)}\]If both models are equally likely a priori, i.e. \(p(M_1) = p(M_2)\), the equation simplifies to \(\frac{p(\mathcal{D} \mid M_1)}{p(\mathcal{D} \mid M_2)}\), a ratio of evidences called the Bayes factor. If this ratio is greater than \(1\), model \(M_1\) is picked, otherwise model \(M_2\) is picked.
For Bayesian linear regression, the evidence of a model has a closed form. For a dataset \(\mathcal{D}\) of inputs \(X\) and outputs \(y\), the outputs \(y = Xw + \epsilon\) are a linear function of the normal weights \(w \thicksim \mathcal{N}(m_0, S_0)\) and of the independent normal noise \(\epsilon \thicksim \mathcal{N}(0, \sigma^2 I)\), so the rules used for the predictive distribution give the evidence as:
\[p(\mathcal{D} \mid M) = p(y \mid X) = \int p(y \mid X, w) \, p(w) \, dw = \mathcal{N} \left( y \mid X m_0, \, X S_0 X^T + \sigma^2 I \right)\]where \(I\) is the \(N \times N\) identity matrix. Notice how the covariance adds the spread of the outputs that the prior allows, \(X S_0 X^T\), to the noise \(\sigma^2 I\).
The evidence favors the simplest model that explains the data, a form of Occam’s razor (PRML book, section 3.4): a flexible model spreads its probability over many possible datasets, and so gives less of it to each one.
Final Remarks
The source code of the closed-form solutions and of the examples above can be downloaded as the Bayesian Linear Regression notebook. A kernelized Bayesian Linear Regression with a zero-mean prior and the kernel \(K(x, x') = x^TS_0x'\) (i.e. \(x^Tx'\) for the prior \(S_0 = I\)) is equivalent to a Gaussian Process. When the output is non-Gaussian but is a member of the exponential family, the corresponding linear models are the Generalized Linear Models.
Appendix: refresher on Linear Algebra
Here is the list of algebraic rules used in this document.
- Multiplication:
- \(A(BC) = (AB)C\);
- \(A(B+C)=AB+AC\);
- \((B+C)A=BA+CA\);
- \(r(AB)=(rA)B=A(rB)\) for a scalar \(r\);
- \(I_mA=A=AI_n\);
- \((y - Xw)^2 = (y-Xw)^T(y-Xw)\).
- Transpose:
- \((A^T)^T = A\);
- \((A+B)^T=A^T+B^T\);
- \((rA)^T = rA^T\) for a scalar \(r\);
- \((AB)^T=B^TA^T\);
- Division:
- if \(rA=B\) and \(A\) is invertible, then \(r=BA^{-1}\);
- if \(Ar=B\) and \(A\) is invertible, then \(r=A^{-1}B\);
- \(Ax=b\) is the system of linear equations \(a_{1,1}x_1 + a_{1,2}x_2 + ... + a_{1,n}x_n = b_1\) for row \(1\), repeated for every row;
- therefore, \(x = A^{-1}b\), if matrix \(A\) has an inverse;
- Inverse:
- \(AA^{-1}=A^{-1}A=I\);
- If \(A\) is invertible, its inverse is unique;
- If \(A\) is invertible, then \(Ax=b\) has a unique solution;
- If \(A\) is invertible, \((A^{-1})^{-1}=A\);
- \(rA^{-1} = (\frac{1}{r}A)^{-1}\) for a scalar \(r\);
- First Order derivatives (in the numerator layout, as in the derivations above):
- \(\frac{d w^TX}{dw} = \frac{d X^Tw}{dw} = X^T\);
- \(\frac{d X^TwY}{dw} = YX^T\);
- \(\frac{d X^Tw^TY}{dw} = XY^T\);
- \(\frac{d X^TwX}{dw} = \frac{d X^Tw^TX}{dw} = XX^T\);
- \(\frac{d \, w^TAw}{dw} = w^T(A+A^T)\);
- Variance and Covariance:
- \(\operatorname{Var}(X) = \operatorname{Cov}(X,X)\);
- \(\operatorname{Var}(rX) = r^2 \operatorname{Var}(X)\), for scalar \(r\);
- \(\operatorname{Var}(X+Y) = \operatorname{Var}(X) + \operatorname{Var}(Y) + 2\operatorname{Cov}(X,Y)\);
- \(\operatorname{Var}(X+Y) = \operatorname{Var}(X) + \operatorname{Var}(Y)\), if X and Y are independent, or more generally uncorrelated (zero covariance);
- \(\operatorname{Var}(X) = \mathbb{E}[(X-\mathbb{E}[X])^2 ] = \mathbb{E} \left[ X^2 - 2X\mathbb{E}[X] + \mathbb{E}[X]^2 \right] = \mathbb{E}[X^2] - 2\mathbb{E}[X]\mathbb{E}[X] + \mathbb{E}[X]^2 = \mathbb{E}[X^2] - \mathbb{E}[X]^2\);
- If \(y\) is a linear transformation of univariate form \(y=mx+b\) or multivariate form \(y=Xw+b\), then:
- Variance in univariate form: \(\operatorname{Var}(y)=m^2 \,\, \operatorname{Var}(x)\);
- Variance in multivariate form: \(\operatorname{Var} (Xw + b) = \operatorname{Var} (Xw) = X \operatorname{Var}(w) X^T = X \Sigma X^T\), where \(\Sigma\) is the covariance matrix of \(w\);
- Expected Value in multivariate form: \(\mathbb{E}[Xw + b] = X \mathbb{E}[w] + b = X \mu + b\), where \(\mu\) is the mean of \(w\)
- formulas 6.50 and 6.51 in Mathematics for Machine Learning