Unsupervised Learning for Association Rules, Outliers and Vector DBs
This post continues the previous post on unsupervised learning with three other tasks, each with a short NumPy implementation:
Association Rule Mining
Association rule learning finds the items that often appear together in a database of transactions, e.g. the products that the customers of a supermarket buy together. A rule \(X \Rightarrow Y\), e.g. \(\{\text{butter}\} \Rightarrow \{\text{eggs}\}\), says that the transactions that hold the itemset \(X\) often hold the itemset \(Y\) too. For a set of transactions \(T\), the quality of a rule is measured by:
- the support of an itemset, the fraction of the transactions that contain it:
- the confidence of a rule, the fraction of the transactions with \(X\) that also contain \(Y\):
- the lift of a rule, above 1 when \(X\) and \(Y\) appear together more often than if they were independent:
The rules are mined in two steps. First, find all the frequent itemsets, whose support is at least a minimum support. Then, split each frequent itemset into the rules whose confidence is at least a minimum confidence. The first step is the hard one: \(m\) items form \(2^m - 1\) itemsets, too many to count one by one. The following algorithms differ in how they search them.
Apriori
The Apriori algorithm is based on the Apriori property: every subset of a frequent itemset is frequent too. Thus, an itemset that has an infrequent subset cannot be frequent, and is not counted. The algorithm searches the itemsets by size:
- count the support of each item, and keep the frequent ones, the itemsets \(L_1\);
- at step \(k\), build the candidate itemsets \(C_k\) of size \(k\) by joining the pairs of itemsets of \(L_{k-1}\) that differ in one item, and remove (prune) every candidate that has a subset of size \(k-1\) not in \(L_{k-1}\);
- scan the database to count the support of each candidate, and keep the frequent ones, \(L_k\);
- stop when \(L_k\) is empty.
The following picture illustrates Apriori on five transactions, {bread, milk}, {bread, butter, eggs}, {milk, butter, eggs, cola}, {bread, milk, butter, eggs} and {bread, milk, butter, cola}, with a minimum support of 3 transactions:
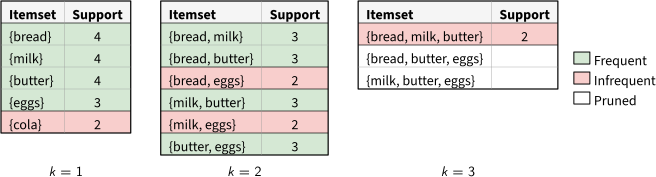
The candidate itemsets of each size \(k\), with their support. The frequent itemsets of size \(k - 1\) form the candidates of size \(k\), and the candidates with an infrequent subset are pruned without counting their support.
The transactions form a boolean matrix, with one row per transaction and one column per item, and the support of an itemset is the number of rows that hold all its items. The following function implements Apriori on this matrix, and returns the support of each frequent itemset:
import numpy as np

items = ['bread', 'milk', 'butter', 'eggs', 'cola']
T = np.array([[1, 1, 0, 0, 0],  # one transaction per row, one item per column
              [1, 0, 1, 1, 0],
              [0, 1, 1, 1, 1],
              [1, 1, 1, 1, 0],
              [1, 1, 1, 0, 1]], dtype=bool)

def apriori(T, min_support):
    L = {frozenset([i]): s for i, s in enumerate(T.sum(0)) if s >= min_support}
    frequent = dict(L)
    while L:
        C = {a | b for a in L for b in L if len(a | b) == len(a) + 1}  # join
        C = [X for X in C if all(X - {i} in L for i in X)]  # prune
        L = {X: T[:, list(X)].all(1).sum() for X in C}  # scan: the support of X
        L = {X: s for X, s in L.items() if s >= min_support}
        frequent.update(L)
    return frequent  # the support of each frequent itemset
Apriori scans the database once per itemset size, and the number of candidates grows very large when the minimum support is low.
ECLAT and FP-Growth
ECLAT (Equivalence Class Transformation) stores, for each item, the set of the transactions that hold it, its tidset. The support of an itemset is then the size of the intersection of the tidsets of its items, with no scan of the database. ECLAT searches the itemsets depth-first, extending each itemset with one item at a time, which is fast as long as the tidsets fit in memory. In the boolean matrix above, the tidset of an item is its column, and the intersection of two tidsets is the logical AND of their columns:
def eclat(T, min_support, prefix=(), tids=None):
    tids = np.ones(len(T), bool) if tids is None else tids  # the tidset of the prefix
    frequent = {}
    for i in range(prefix[-1] + 1 if prefix else 0, T.shape[1]):  # each later item
        t = tids & T[:, i]  # the intersection of the two tidsets
        if t.sum() >= min_support:
            frequent[frozenset(prefix + (i,))] = t.sum()
            frequent.update(eclat(T, min_support, prefix + (i,), t))  # depth-first
    return frequent
FP-growth (Frequent Pattern growth) generates no candidates at all. It scans the database twice: first, to count the support of each item; then, to insert the frequent items of each transaction, sorted by decreasing support, into a prefix tree, the FP-tree. Transactions that share a prefix share a path in the tree, and each node counts the transactions that pass through it, so the tree is a compressed copy of the database. Then, for each item, from the least frequent one, FP-growth collects the paths of the tree that end at that item (its conditional pattern base), builds a smaller FP-tree from them, and mines it recursively. The following picture illustrates the FP-tree of the transactions above, and the mining of eggs:
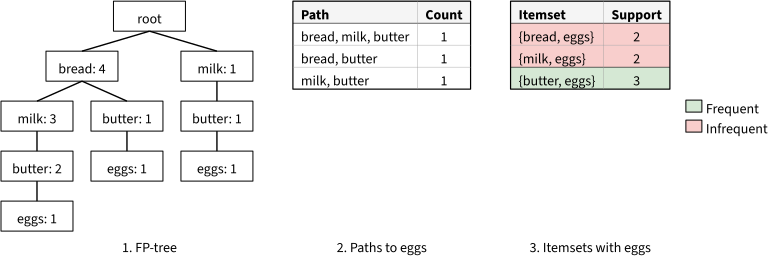
1. The FP-tree of the transactions, with the number of transactions that pass through each node. 2. The conditional pattern base of eggs: the paths from the root to each node of eggs. 3. The support of each item of these paths together with eggs: only {butter, eggs} is frequent.
The following function implements FP-growth, with the FP-tree as nested dictionaries. It takes the transactions as pairs of items and counts, the form of the conditional pattern bases that it mines recursively, e.g. fp_growth([(np.flatnonzero(t), 1) for t in T], 3):
def fp_growth(T, min_support, suffix=()):
    counts = {}
    for items, c in T:  # first scan: the support of each item
        for i in items:
            counts[i] = counts.get(i, 0) + c
    order = [i for i in counts if counts[i] >= min_support]  # the frequent items,
    order.sort(key=lambda i: -counts[i])  # by decreasing support
    tree = {}  # the FP-tree, as nested {item: [count, children]}
    for items, c in T:  # second scan: insert the frequent items of each transaction
        node = tree
        for i in sorted([i for i in items if i in order], key=order.index):
            entry = node.setdefault(i, [0, {}])
            entry[0] += c
            node = entry[1]
    frequent = {}
    for i in reversed(order):  # each item, from the least frequent one
        frequent[frozenset(suffix + (i,))] = counts[i]
        base = [(path, c) for path, j, c in nodes(tree) if j == i]  # its pattern base
        frequent.update(fp_growth(base, min_support, suffix + (i,)))
    return frequent

def nodes(tree, path=()):  # each node, with the items on its path from the root
    for i, (c, children) in tree.items():
        yield path, i, c
        yield from nodes(children, path + (i,))
In practice, FP-growth is usually faster than Apriori, as it scans the database only twice and generates no candidates, while ECLAT is fast on dense datasets whose tidsets fit in memory.
Outlier Detection
Anomaly detection (or outlier detection) finds the data points that differ much from the rest of the data, such as fraudulent transactions or failing machines. Some clustering methods already detect outliers: DBSCAN labels them as noise, and a Gaussian mixture gives them a low likelihood. The two methods of this section are dedicated to the task, and give each point an anomaly score.
Isolation Forest
An isolation forest is based on the observation that anomalies are few and different, so they are easier to isolate than normal points. An isolation tree splits the data recursively: each node picks a random feature and a random split value between the minimum and the maximum of that feature, until each point is alone in a leaf. An anomaly, far from the other points, is isolated after a few splits, close to the root, while a point in a dense region needs many:
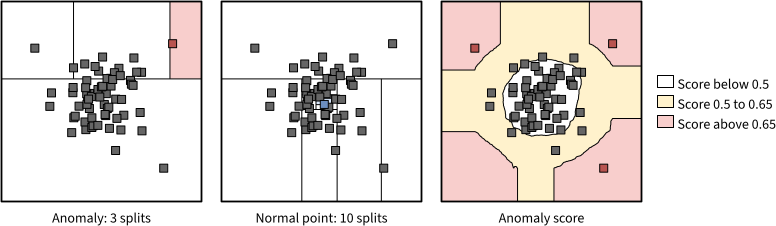
Points of a 2D Gaussian and 3 anomalies. Left and center: the random splits of an isolation tree, until an anomaly (red) or a normal point (blue) is alone in its cell. Right: the anomaly score of a forest of trees built on all the points. The splits are parallel to the axes, which gives the score map its cross shape.
The anomaly score of a point \(x\) is computed from its path length \(h(x)\), the number of splits from the root to its leaf, averaged over the trees of the forest:
\[s(x, m) = 2^{- \mathbb{E}[h(x)] / c(m)}\]where \(m\) is the number of points of each tree, and \(c(m) = 2 H(m-1) - 2(m-1)/m\) normalizes \(h(x)\). It is the average path length of an unsuccessful search in a binary search tree of \(m\) points, with the harmonic number \(H(i) \approx \ln(i) + 0.5772\). A score close to 1 marks an anomaly, and a score well below 0.5 a normal point.
Each tree is built on a small random subsample of the data, and its depth can be limited to about \(\log_2 m\), as only the short paths matter. Thus, an isolation forest computes no distances, its cost grows linearly with the number of points, and it scales to large datasets. The following functions implement it, with each tree as nested tuples, with the feature and the value of each split, and each leaf as its number of points:
def c(n):  # the average path length of an unsuccessful search in a BST of n points
    if n <= 2:
        return 1.0 if n == 2 else 0.0
    return 2 * (np.log(n - 1) + 0.5772) - 2 * (n - 1) / n

def isolation_tree(X, depth, rng):  # a node (f, s, left, right), or the leaf size
    if depth == 0 or len(X) <= 1:
        return len(X)
    f = rng.integers(X.shape[1])  # a random feature, and a random split value
    s = rng.uniform(X[:, f].min(), X[:, f].max())
    left = X[:, f] < s
    return (f, s, isolation_tree(X[left], depth - 1, rng),
            isolation_tree(X[~left], depth - 1, rng))

def path_length(x, node):  # h(x): the depth of x, plus c(n) in a leaf of n points
    if not isinstance(node, tuple):
        return c(node)
    f, s, left, right = node
    return 1 + path_length(x, left if x[f] < s else right)

def isolation_forest(X, trees=100, m=256, seed=0):
    rng = np.random.default_rng(seed)
    m = min(m, len(X))  # the number of points of each tree
    depth = int(np.ceil(np.log2(m)))  # the maximum depth of a tree
    forest = [isolation_tree(X[rng.choice(len(X), m, replace=False)], depth, rng)
              for _ in range(trees)]
    h = np.array([[path_length(x, tree) for tree in forest] for x in X])
    return 2 ** (-h.mean(1) / c(m))  # the anomaly score s(x, m)
Local Outlier Factor
The local outlier factor (LOF) compares the density around a point with the density around its neighbors. A point in a sparse region is not an outlier when its neighbors lie in a sparse region too, so LOF also finds outliers in data with clusters of different densities, where a single distance threshold fails. With the \(k\) nearest neighbors \(N_k(p)\) of a point \(p\), and the distance \(d_k(o)\) from a point \(o\) to its \(k\)-th nearest neighbor:
- the reachability distance of \(p\) from \(o\) is \(\text{reach}_k(p, o) = \max \{ d_k(o), d(p, o) \}\), i.e. the distance between them, but at least \(d_k(o)\), which smooths the distances within a dense region;
- the local reachability density of \(p\) is the inverse of its average reachability distance from its neighbors:
- the LOF of \(p\) is the average ratio between the densities of its neighbors and its own:
A LOF close to 1 means that the point is as dense as its neighbors, and a LOF much larger than 1 that it is an outlier. The following picture compares LOF with a global method, the distance to the \(k\)-th nearest neighbor:
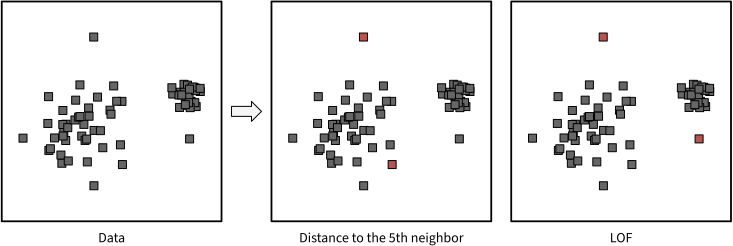
A sparse cluster, a dense cluster, a global outlier (top) and a local outlier under the dense cluster, with the two points of highest score of each method in red, for \(k = 5\). The distance to the 5th nearest neighbor flags the global outlier and a point of the sparse cluster, while LOF flags both outliers.
The following function computes the LOF of each point:
def lof(X, k):
    D = np.sqrt(((X[:, None] - X) ** 2).sum(2))
    np.fill_diagonal(D, np.inf)  # a point is not its own neighbor
    N = np.argsort(D, 1)[:, :k]  # the k nearest neighbors of each point
    rows = np.arange(len(X))[:, None]
    dk = D[rows[:, 0], N[:, -1]]  # the distance to the k-th nearest neighbor
    reach = np.maximum(dk[N], D[rows, N])  # reach_k(p, o), for each neighbor o of p
    lrd = 1 / reach.mean(1)
    return lrd[N].mean(1) / lrd
LOF needs the \(k\) nearest neighbors of each point, i.e. \(O(n^2)\) distances with a brute-force search. For the sake of comparison, an isolation forest is faster and scales to large datasets, while LOF finds the local outliers next to a dense cluster that a global method may miss.
Vector Databases
A large language model answers with the knowledge stored in its weights. Retrieval-augmented generation (RAG) gives it other knowledge, such as private or recent documents. The documents are split into chunks, and each chunk is mapped to an embedding, a vector of hundreds to thousands of dimensions computed by a neural network. The vectors are stored in a vector database. At inference time, the question is embedded in the same way, the database returns the chunks whose embeddings are closest to it, and the model answers from the question and these chunks. The core of a vector database is thus the search of the nearest neighbors of a query, as in KNN, over millions to billions of vectors.
The Curse of Dimensionality
Distance-based methods, such as k-means, KNN, DBSCAN and LOF, struggle with high-dimensional data. This is due to the curse of dimensionality: as the number of dimensions grows, the distances between any two points become similar, and the nearest and the farthest neighbors of a point end up at almost the same distance. The reason is that the squared distance between two points is a sum of one term per dimension. Its mean grows with the number of dimensions \(d\), while its spread grows only with \(\sqrt{d}\), so that the spread relative to the mean shrinks as \(1/\sqrt{d}\). The following picture shows how the distances concentrate around their mean as the number of dimensions grows:
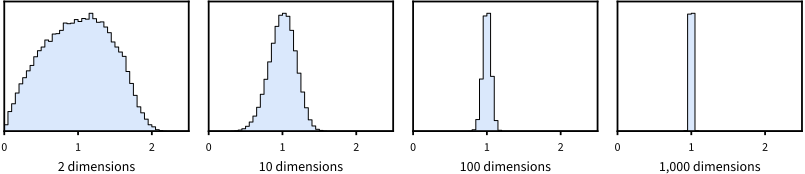
Histograms of the distances from random query points to points drawn uniformly in the unit cube, each divided by the mean distance from its query point. In 2 dimensions, the distances range from almost 0 to twice the mean, while in 1,000 dimensions they are all close to the mean.
This is one more reason to reduce the dimensionality of the data, e.g. with PCA, before clustering it. It also hits the spatial indexes of databases. In low dimensions, a k-d tree splits the space with one axis-aligned plane per node, and a query visits only the few regions of the space near it. In high dimensions, all regions are about as close to the query, so the search visits almost all of them, and is no faster than a scan of all the vectors. Vector databases therefore use an approximate nearest neighbor (ANN) search, which returns most of the true nearest neighbors, i.e. a high recall, for a small fraction of the work.
Embeddings and Similarity
An embedding model is trained so that related inputs have close embeddings. Most text and image embedding models are trained by contrastive learning: the model gets a batch of \(B\) pairs of related inputs, e.g. a question and the passage that answers it, or two crops of one image, and learns to make the embeddings of each pair similar, and those of the other inputs of the batch dissimilar. For a question with the embedding \(q\), the embedding \(k^+\) of its passage (the positive key) and the embeddings \(k^-\) of the other passages of the batch (the negative keys), the common InfoNCE loss is given by:
\[\mathcal{L}_q = - \log \frac{\exp \left( \cos(q, k^+) / \tau \right)}{\exp \left( \cos(q, k^+) / \tau \right) + \sum_{k^-} \exp \left( \cos(q, k^-) / \tau \right)}\]where \(\tau\) is a temperature, and the cosine similarity of two vectors is their dot product divided by their norms:
\[\cos(a, b) = \frac{a^T b}{\| a \| \| b \|}\]In practice, the softmax of the similarities over \(\tau\) is a categorical distribution over the passages of the batch, and \(\mathcal{L}_q\) is the negative log-probability of the right passage. So InfoNCE is the cross-entropy of a classification whose classes are the passages. As the cosine ignores the norms, training turns the embeddings of each question and its passage toward each other, and away from the other passages, whatever their lengths. The loss of the batch is the mean of \(\mathcal{L}_q\) over its \(B\) questions, where each row of the \(B \times B\) matrix of similarities must pick its own passage, on the diagonal:
def info_nce(Q, K, tau=0.1):
    Q = Q / torch.norm(Q, dim=-1) # [Q, E] / [Q, 1] -> [Q, E]
    K = K / torch.norm(K, dim=-1) # [Q, E] / [K, 1] -> [K, E]
    S = Q @ K^T # [Q, E] @ [E, K] = [Q, K]
    S = torch.cos(S) / tau  # Similarity Matrix [Q, K]

    # option A: computation of all terms as in the formula
    L_ = S.diagonal().exp() / S.exp().sum(dim=1)
    return -torch.log(L_).mean()
or
    # B: via softmax (readable)
    P = torch.softmax(S, dim=1)                   # [Q, K], each row sums to 1
    return -torch.log(torch.diagonal(P)).mean()      # diag(P) already is p(k_i | q_i)
or
    # C: via logsumexp on the logits (stable, preferred)
    # Loss = -1/Q sum_i log p(k_i | q_i),  where p is the softmax over row i
    return -(torch.diagonal(S) - torch.logsumexp(S, dim=1)).mean()
Note that these models do not train with the older contrastive loss, despite the similar name. That loss compares the inputs one pair at a time, each pair labeled as similar or dissimilar, while a search must pick the right passage among many. InfoNCE trains exactly that: each question is compared with all the passages of the batch at once, and gets \(B-1\) negatives from a single matrix multiplication.
A vector database ranks the vectors by one of three measures:
- the dot product \(a^T b\) grows with the alignment of the vectors and with their norms. It is the cheapest of the three, and the measure of models whose score includes the norms, e.g. matrix factorization, which predicts a rating as the dot product of a movie vector and a user vector.
- the cosine similarity \(\cos(a, b)\) above is the dot product divided by the norms, so it only sees the angle between the vectors. It is the measure of most text embedding models, as their loss, like the InfoNCE above, is computed on it.
- the Euclidean distance \(\| a - b \|\) is the length of the difference of the vectors, so it is small for vectors that point the same way and have similar norms. It is the distance of k-means, and thus of the indexes below.
On unit vectors, the three measures give the same neighbors, as the dot product is then the cosine similarity, and:
\[\| a - b \|^2 = \| a \|^2 + \| b \|^2 - 2 a^T b = 2 - 2 \cos(a, b)\]So the embeddings of such models are normalized to unit length when they are stored, and a search can use any of the three measures. Without the normalization, the measures disagree: the dot product favors the long vectors, and the Euclidean distance the vectors whose norm is close to the one of the query. The right measure is then the one that the model was trained with.
Embeddings escape the curse of dimensionality only in part: they lie close to a surface of much lower dimension than their number of coordinates, so the nearest neighbors of a query still stand out from the rest. An exact search scores all the \(n\) vectors of the database, i.e. \(O(nd)\) operations per query in \(d\) dimensions. The following methods score only a small part of them, and their code uses the squared Euclidean distance on unit vectors.
Inverted File Index
An inverted file index (IVF) clusters the vectors with k-means, and keeps the list of the vectors of each cluster, i.e. of each Voronoi cell of the means. A query is compared with the means, and only the vectors of its few closest cells (the probes) are searched:
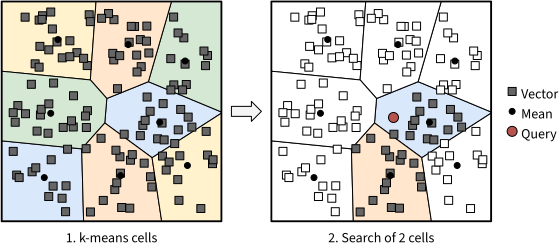
1. The vectors, clustered by k-means into cells, with their means (black dots). 2. A query (red) is compared with the means, and only the vectors of its 2 closest cells (colored) are searched; the other vectors (white) are skipped.
IVF clusters the vectors once, with W, cells = kmeans(X, 100) (the kmeans function of the previous post), and a query scans only the vectors of its probes closest cells:
def ivf_search(X, W, cells, q, k, probes=5):
    nearest = np.argsort(((W - q) ** 2).sum(1))[:probes]  # the cells closest to q
    ids = np.flatnonzero(np.isin(cells, nearest))  # the vectors of these cells
    return ids[np.argsort(((X[ids] - q) ** 2).sum(1))[:k]]  # the k nearest among them
A nearest neighbor in a cell that is not probed is missed, which makes the search approximate: more probes return more of the true nearest neighbors, at a higher cost.
Product Quantization
Product quantization (PQ) compresses the vectors. Each vector is split into \(m\) sub-vectors, and each sub-vector is replaced by the index of its closest mean in a small k-means codebook of its part, e.g. one byte for 256 means. With 64 sub-vectors, an embedding of 1,024 FP32 values (4 KB) is stored in 64 bytes. The distance from a query to a stored vector is the sum of the distances from the sub-vectors of the query to the means of the codes, read from one small table per part:
def pq_index(X, parts=8, centroids=256):
    books, codes = [], []
    for P in np.split(X, parts, axis=1):  # the sub-vectors of all vectors, part by part
        W, labels = kmeans(P, centroids)  # the codebook of the part
        books.append(W)
        codes.append(labels)
    return books, np.array(codes, dtype=np.uint8).T  # one byte per sub-vector

def pq_search(books, codes, q, k):
    tables = [((W - p) ** 2).sum(1) for W, p in zip(books, np.split(q, len(books)))]
    dist = sum(table[codes[:, j]] for j, table in enumerate(tables))  # table lookups
    return np.argsort(dist)[:k]
The distances of PQ are approximate, so its best candidates are usually ranked again with their exact distances. PQ is often combined with IVF (IVF-PQ), to search billions of vectors that do not fit in memory in full.
HNSW
HNSW (Hierarchical Navigable Small World) is a graph index: each vector is a node, linked to its nearest neighbors. The graph has several layers: the bottom layer holds all the nodes, and each layer above holds a random subset of the nodes of the layer below, with longer links. A query starts at the top layer, and walks greedily from node to node, always to the neighbor closest to the query, until no neighbor is closer. It then goes down one layer, from the node where it stopped, and repeats the walk until the bottom layer. Thus, the upper layers make long jumps across the data, and the lower layers refine the search:
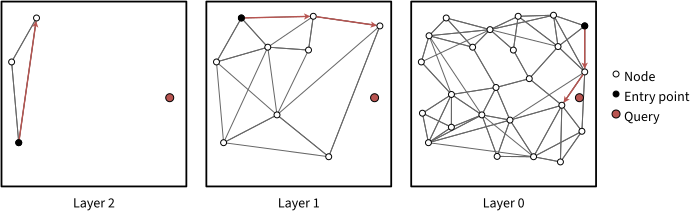
The three layers of an HNSW graph of 2D points, from the top layer (left) to the bottom layer (right), which holds all the points. In each layer, the walk of the query (red) starts at the entry point (black), and moves to the neighbor closest to the query (red arrows) until no neighbor is closer. The node where it stops is the entry point of the layer below, and the walk ends at the nearest neighbor of the query in the bottom layer.
A new vector is inserted with the same search: it gets a random top layer, so that each layer holds about \(1/M\) of the nodes of the layer below, and it is linked to its \(M\) nearest nodes in each layer below its top (and \(2M\) in the bottom layer). In the following code, search_layer is a best-first search in one layer: it keeps the ef nearest nodes that it has found, and expands the nearest one that it has not expanded yet, until all of them are expanded. With ef = 1, it is the greedy walk of the picture:
def search_layer(X, graph, q, entries, ef):  # the ef nearest nodes to q that it finds
    found = sorted(zip(((X[entries] - q) ** 2).sum(1), entries))  # (distance, node)
    seen, done = set(entries), set()
    while todo := [i for _, i in found if i not in done]:  # the nodes not expanded yet
        done.add(todo[0])  # expand the nearest of them
        new = [j for j in graph[todo[0]] if j not in seen]
        seen.update(new)
        found = sorted(found + list(zip(((X[new] - q) ** 2).sum(1), new)))[:ef]
    return [i for _, i in found]

def nearest(X, i, nodes, M):  # the M nodes closest to node i
    return sorted(nodes, key=lambda j: ((X[i] - X[j]) ** 2).sum())[:M]

def hnsw_index(X, M=8, ef=32, seed=0):
    rng = np.random.default_rng(seed)
    graphs, entry = [], 0  # graphs[l][i]: the neighbors of node i in layer l
    for i in range(len(X)):
        top = int(rng.exponential() / np.log(M))  # the top layer of node i
        ep = [entry]
        for l in range(len(graphs) - 1, -1, -1):  # from the top layer down
            ep = search_layer(X, graphs[l], X[i], ep, ef if l <= top else 1)
            if l <= top:  # links to its M nearest nodes, and back
                graphs[l][i] = ep[:M]
                for j in ep[:M]:
                    graphs[l][j] = nearest(X, j, graphs[l][j] + [i], 2 * M if l == 0 else M)
        if top >= len(graphs):  # new layers, with node i as their entry point
            graphs += [{i: []} for _ in range(top + 1 - len(graphs))]
            entry = i
    return graphs, entry

def hnsw_search(X, graphs, entry, q, k, ef=32):
    ep = [entry]
    for graph in graphs[:0:-1]:  # a greedy walk in each upper layer, from the top
        ep = search_layer(X, graph, q, ep, 1)
    return search_layer(X, graphs[0], q, ep, max(ef, k))[:k]
For the sake of comparison, IVF is cheap to build, and needs little memory besides the vectors. PQ stores each vector in a few bytes, at the cost of approximate distances. HNSW reaches the highest recall for a given query time, but its index is slow to build and keeps the full vectors and their links in memory. Thus, HNSW is the usual choice when the vectors fit in memory, and IVF-PQ when they do not.
Distributed Vector Databases
Libraries such as FAISS implement these indexes on CPUs and GPUs, and combine them, e.g. IVF with PQ. When the vectors do not fit in the memory of one GPU or one node, the index is split into shards, each with a part of the vectors and its own index. A query is sent to all shards (a scatter), each shard returns its \(k\) nearest vectors, and these are merged into the global top-\(k\) (a gather). The latency of a query is thus the latency of the slowest shard, plus the merge:
def sharded_search(shards, q, k):  # the ids and the vectors of each shard
    D, I = [], []
    for ids, X in shards:  # in parallel, one shard per GPU or node
        d = ((X - q) ** 2).sum(1)  # or any of the indexes above
        top = np.argsort(d)[:k]  # the local top-k
        D.append(d[top])
        I.append(ids[top])
    D, I = np.concatenate(D), np.concatenate(I)  # gathered
    return I[np.argsort(D)[:k]]  # the global top-k
FAISS shards an index across the GPUs of a node, and distributed vector databases, such as Milvus, shard it across the nodes of a cluster, and replicate the shards to serve more queries at a time. Thus, the ideas of the previous post, k-means clustering, Voronoi cells and graphs of nearest neighbors, are what make the search over billions of embeddings fast enough for RAG.